Mean absolute percentage error (MAPE) measures forecast accuracy by averaging each period’s absolute forecast error as a percentage of that period’s actual demand. For demand d and forecast f, calculate each absolute percentage error as abs(f − d) / d, then average the results. section 8.4 section 8.4.1
A four-period calculation
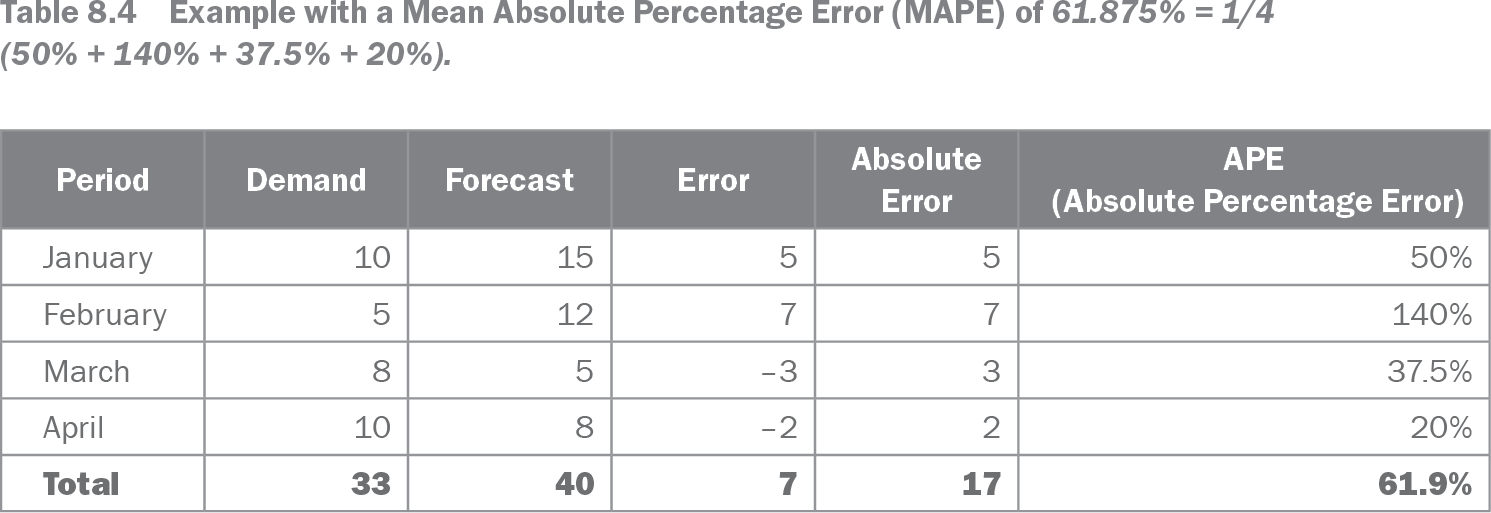
For demands of 10, 5, 8, and 10 and forecasts of 15, 12, 5, and 8, the absolute percentage errors are 50%, 140%, 37.5%, and 20%. Their average is 61.875%, or about 61.9%. section 8.4
Use MAPE cautiously because its percentage normalization changes how errors influence the result:
- Weights errors during low-demand periods heavily; a relatively small absolute error can create a large percentage error. section 8.4.2
- Becomes undefined when actual demand is zero, making it unusable for datasets containing zero-demand periods. section 9.2
- Favors conservative forecasts because a zero forecast cannot exceed 100% error, while an excessively high forecast has no equivalent cap. section 8.4.2
- Barely reflects extreme demand values, whereas MAE or MAE% provides a better compromise for extreme patterns. section 9.1
Table 8.4 Example with a Mean Absolute Percentage Error (MAPE) of 61.875% = 1/4 (50% + 140% + 37.5% + 20%). (view table figure)
| Period |
Demand |
Forecast |
Error |
Absolute Error |
APE (Absolute Percentage Error) |
|---|---|---|---|---|---|
| January |
10 |
15 |
5 |
5 |
50% |
| February |
5 |
12 |
7 |
7 |
140% |
| March |
8 |
5 |
–3 |
3 |
37.5% |
| April |
10 |
8 |
–2 |
2 |
20% |
| Total |
33 |
40 |
7 |
17 |
61.9% |
Inspect the period-by-period demand, forecast, error, absolute error, and percentage error before accepting the aggregate MAPE. section 8.4
MAPE is often confused with MAE%. Specify the calculation whenever comparing forecast errors. For model or process assessment, track MAE and bias instead; MAPE is described as highly skewed and likely to encourage under-forecasting. section 8.4.2 section 9.5