The median is the middle value of an ordered dataset, or the average of the two middle values when the dataset has even size. As a measure of central tendency, it describes a dataset’s typical position without allowing extreme values to dominate. section 4.1.1
Use the median deliberately when interpreting and reporting data:
- Report the median for skewed or asymmetrical distributions because it masks the effect of extreme outliers. section 4.1.2
- Compare it with the mean when the distribution is symmetrical or when stakeholders need more than one view of central tendency. section 4.1.1
- Pair it with the range, interquartile range, or a distribution visualization when a single center does not adequately describe the data. section 4.1.2
Outlier comparison
Replacing a highest value of 97 with a value closer to the rest of the dataset leaves the median unchanged, while the mean changes noticeably. section 4.1.1
Practice workflow
Generate a distribution in Python, calculate its mean and median, inspect its shape, and decide which measure is more appropriate to share with stakeholders. section 4.1.3
Figure 4.7 The median is robust to skewed data and outliers. When the highest outlier value of 97 is replaced with a value closer to the rest of the set, the median remains the same.
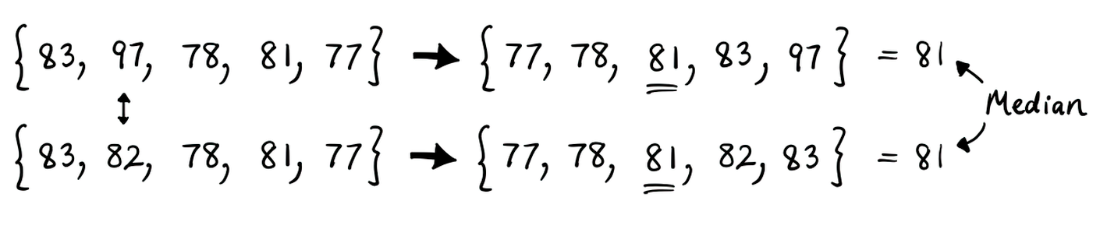
Compare how the median and mean respond when an extreme value changes. section 4.1.1






