A metric endpoint exposes an application's or system's current measurements in a machine-readable format. A monitoring tool such as Prometheus periodically pulls the endpoint, stores values with timestamps, and makes them available for inspection. section 9.1
Use a metric endpoint to connect an application or platform to monitoring:
- Configure the Docker Engine or application to expose metrics at a reachable endpoint such as /metrics. section 9.1
- Configure Prometheus to scrape the endpoint on a schedule and verify the target is healthy. section 9.1
- Filter collected measurements or graph them in the Prometheus web UI. section 9.1
Application monitoring lab
Run the instrumented to-do list application, browse to its /metrics URL, and connect it to Prometheus and Grafana. A useful dashboard shows tasks created, total HTTP requests processed, and requests currently being processed. section 9.6
Prometheus has a simple web UI that you can use to find metrics and run queries.
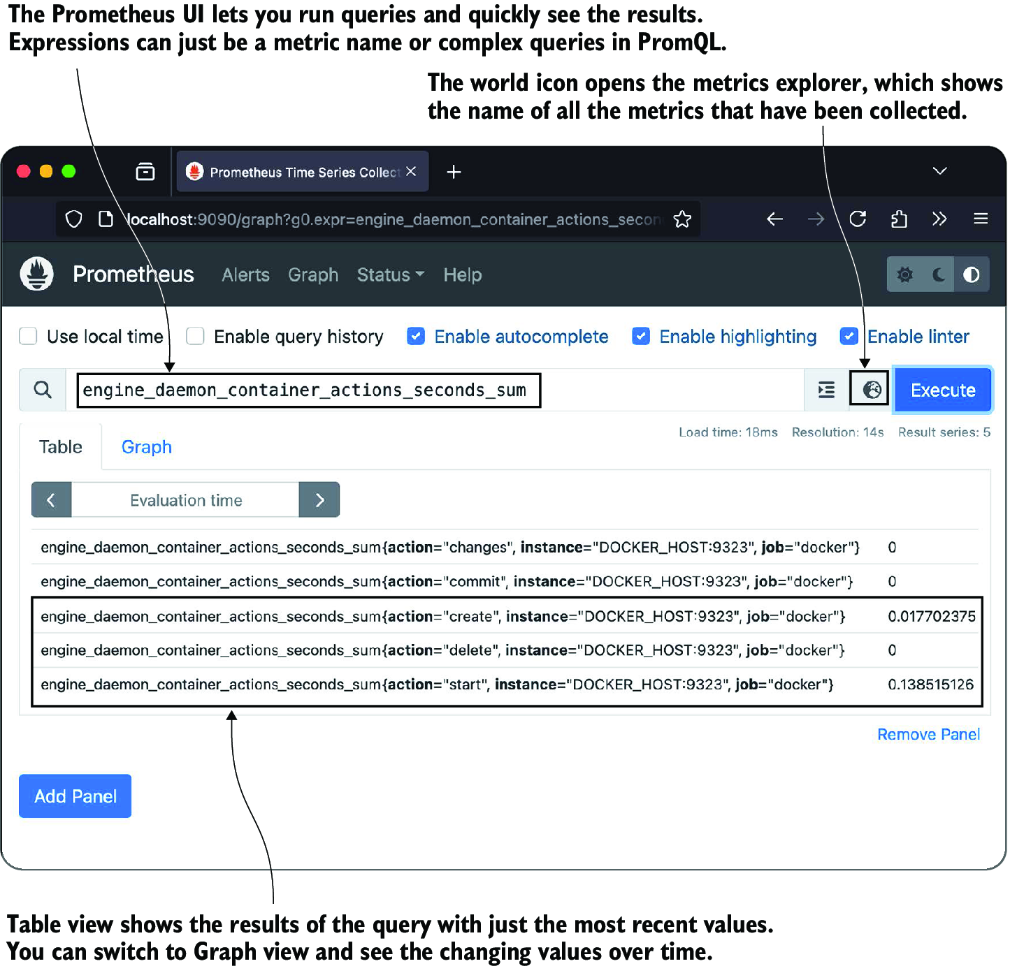
Use the Prometheus interface to find collected metrics and run queries against them. section 9.1



