A metric endpoint exposes an application's operational measurements over HTTP so Prometheus can collect them. A monitoring worker scrapes a path such as /metrics, stores the results as time series, and supports visualization and alerting through Grafana and Alertmanager. section 3.5
A production metric endpoint connects application instrumentation to the monitoring stack:
- Expose standard measurements such as request counts, response times, latency, and response codes. section 3.5 section 6.1.3
- Let Prometheus pull and store the endpoint output, then query it with PromQL. section 3.5
- Visualize queried series in Grafana and route threshold-based alerts through Alertmanager. section 3.5
- Configure Kubernetes discovery with scrape annotations that identify the path and port. section 3.5
FastAPI endpoint with Starlette Exporter
Add PrometheusMiddleware to collect basic application metrics, then register handle_metrics at /metrics. This exposes measurements without implementing the endpoint logic manually. section 3.5
Figure 3.17 Application 1 and Application 2 expose an endpoint for metrics. Prometheus scrapes those metrics, which are then visualized by Grafana. Alertmanager uses those metrics to check if any alerts need to be routed to a channel; in this case, it’s an email.
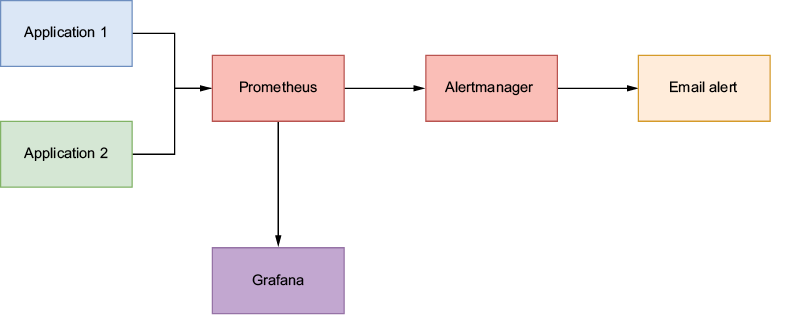
Trace the operational flow from application endpoints through Prometheus scraping and Grafana visualization to Alertmanager notification routing. section 3.5



