Negative correlation describes an inverse relationship: as one variable increases, the other tends to decrease. This differs from no correlation, where the variables show no suggestive relationship. section 7.1
Read the direction and strength together:
- A Pearson correlation ranges from -1 to 1. Values closer to -1 indicate increasingly strong negative linear correlation; values near 0 indicate little or no linear correlation. section 7.2
- A moderately negative value may be near -0.5. Stronger relationships place the data points more closely along a line. section 7.2
- Correlation can suggest a relationship, but it does not establish causation. A coincidental relationship can appear even when common sense gives no causal explanation. section 7.1
A quick everyday test
Hours spent on social media may negatively correlate with a happiness score: more social media time tends to accompany less happiness. By contrast, sleep and next-day rainfall should not be treated as meaningfully related merely because a small dataset happens to show an upward or downward pattern. section 7.1
Figure 7.3 Different Pearson correlation values with different datasets. Note how a strong positive correlation (close to 1) or negative correlation (close to -1) has data that more closely resembles a line.
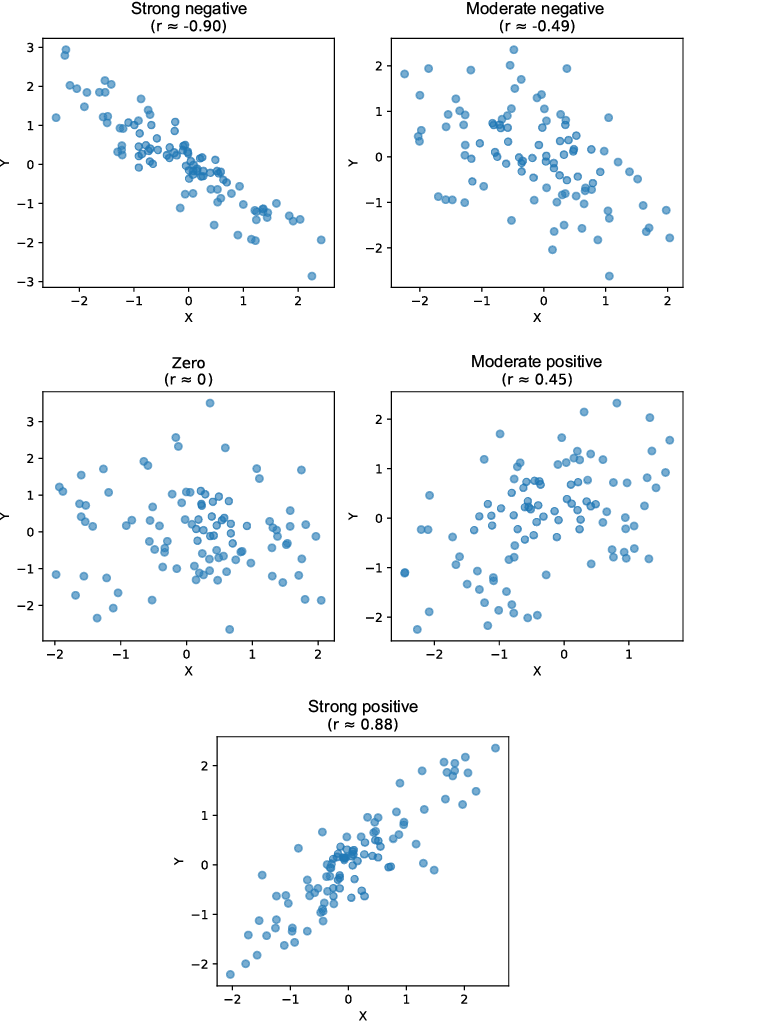
Compare scatterplots across correlation values; strong negative relationships show points clustering around a downward-sloping line. section 7.2
