Network data represents entities as nodes and their connections as edges or links. Unlike a hierarchy, a network can have many-to-many connections. It is a way to look for patterns in relationships, not only at individual entities. Node/edge lists are one way to represent network data. section 3.1.3 section 12.0
Figure 3.6 Network data consists of objects and the connections between them. The objects are typically referred to as nodes or vertices, and the connections are referred to as edges or links. Networks are often represented using force-directed algorithms, such as the example here, that arrange the network in such a way as to pull connected nodes toward each other.
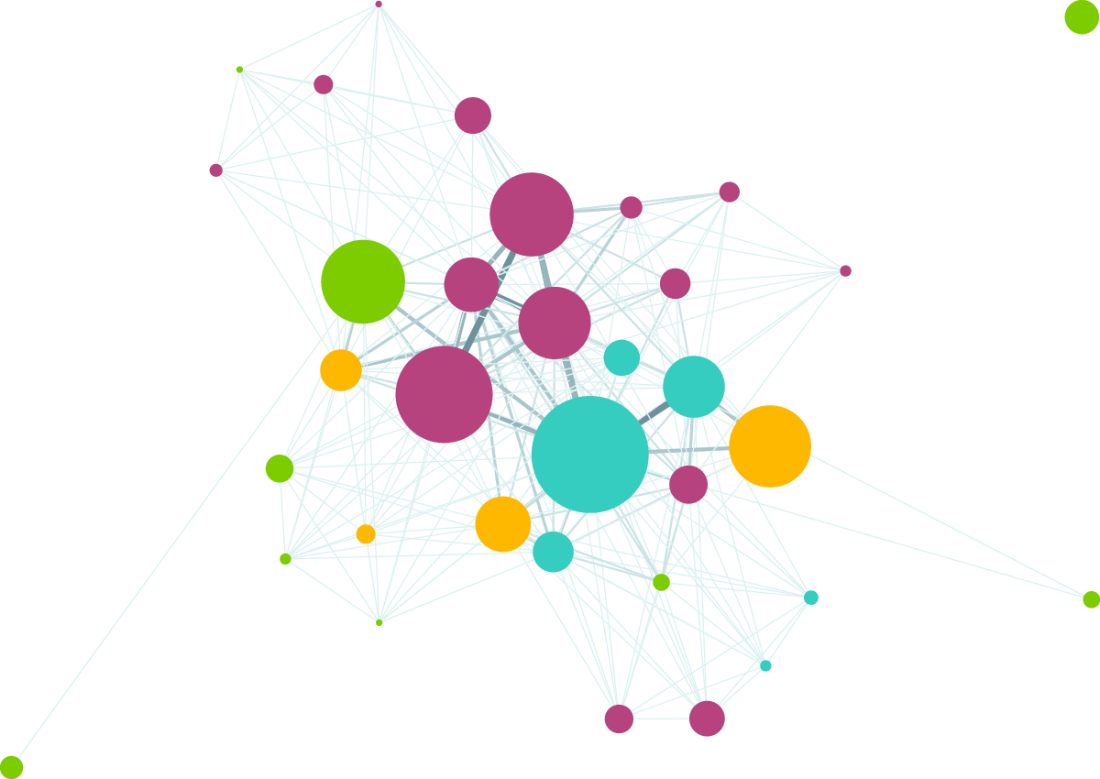
See how nodes and edges form a network, and how a force-directed layout pulls connected nodes toward one another. section 3.1.3
Common network visualization forms include:
- Adjacency matrices section 12.0
- Arc diagrams section 12.0
- Beeswarm plots and network graphs, created with D3 force-directed layouts. section 12.0