A null hypothesis (H0) is the starting claim that an observed difference, variance, or relationship is due to chance. A significance test then provides grounds to reject H0 or to fail to reject it; rejecting H0 means accepting the alternative hypothesis (H1). section 20.2
For two-group comparisons, the null hypothesis commonly says the group means are equal. A t-test weighs the difference in means, group variances, and record counts to judge whether the observed difference is essentially zero or different from zero. section 7.4.1 section 12.7.2
Use a null hypothesis as a practical testing workflow:
- State the baseline before looking for an effect: for example, home and road teams receive equal personal-foul calls and free-throw attempts, with any difference due to chance. section 7.0
- Choose a significance test appropriate to the data; t-tests compare two numeric groups, while other tests include chi-square, correlation, and F-tests. section 7.0 section 20.2
- Set a threshold before interpreting the p-value. With the commonly used 5% threshold, p-values below 0.05 reject H0, while larger p-values fail to reject it. section 7.4.1 section 20.2
- Keep effect size separate from the hypothesis decision: Cohen's d measures the magnitude of a difference but does not determine whether to reject H0. section 7.0
Home versus road foul calls
For the 2018–19 regular season, the baseline claim is that home and road teams have equal mean personal fouls. R's Welch two-sample t-test reports road-team mean 21.09512, home-team mean 20.71301, and p = 0.02727. Because this is below 0.05, reject the equal-means null hypothesis; the result does not by itself establish why the difference exists. section 7.4.1
Salary inequality and championships
A second comparison tests whether championship teams and other teams have equal average Gini coefficients. The displayed means are 0.53 for champions and 0.48 for other teams, with p = 0.006245, supporting rejection of the chance-variation null hypothesis at the 5% threshold. section 12.7.2
Figure 20.2 Significance tests start with a null hypothesis that is subsequently rejected or not rejected based on a p-value with a 5% threshold. Which significance test to run is conditioned on the data (usually, but not always, continuous versus categorical). Significance tests are usually run from base R functions, and the results are typically visualized through packaged functions.
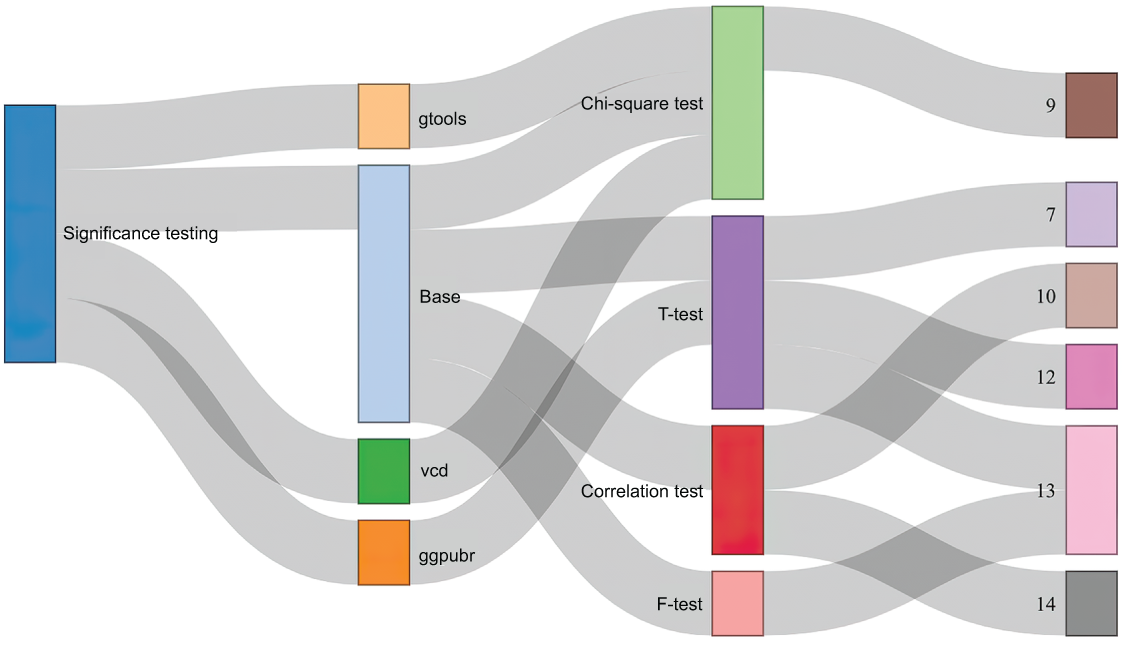
This process map ties the null hypothesis to p-value decisions, data-dependent test selection, base R testing, and visualization. section 20.2



