Observational data are collected without assigning or controlling the conditions under which observations occur. Unlike experimental data from an A/B test or RCT, these data record what happened in the world. They support description and prediction, but causal questions require extra care because treatment choices may be linked to other factors. section 1.1.1 section 1.4
Common forms include:
- Customer databases linking marketing efforts to customer actions. section 1.4
- Sales records used to examine changes after company decisions. section 1.4
- Cross-country data relating COVID-19 policies to virus spread. section 1.4
Kidney-stone treatments
A hospital compared two treatments using records from 700 patients rather than an RCT. Overall recovery favored treatment B, 81% versus 78%. After separating patients by stone size, treatment A performed better for both small and large stones. This Simpson’s paradox shows why a simple comparison can mislead when treatment groups differ in relevant characteristics. section 2.1 section 2.9
Figure 1.4 Both arcade revenue and computer science doctorates increase when the population increases, so the population is a potential common cause between the two.
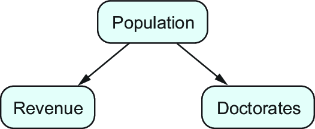
A causal diagram can expose a potential common cause: population growth may increase both arcade revenue and computer science doctorates, making their strong correlation non-causal. section 1.4


