Causal adjustment estimates what would happen if everyone received a chosen treatment, rather than simply comparing the outcomes of people who happened to receive different treatments. It removes confounding bias by combining outcome estimates within confounder groups according to the target population’s distribution. section 2.2.5 section 2.2
A confounder affects both treatment assignment and the outcome. For example, age can influence which medication a patient receives and how quickly they recover. A raw comparison then mixes the medication effect with age differences; adjustment instead compares treatments within relevant groups and reweights those results. section 1.4.2 section 2.0
Figure 1.6 Apart from how treatment may affect recovery, there’s a third element affecting both simultaneously. These elements are called confounders. For instance, in this example, age is a confounder.
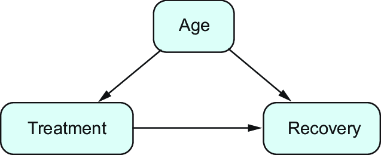
Use the graph to distinguish the treatment-to-outcome relationship from the shared cause that must be accounted for. section 1.4.2
Apply causal adjustment as a structured causal analysis:
- Draw a DAG and state the intervention question, such as the outcome if everyone received treatment A versus B. section 2.2 section 3.1
- Decide whether adjustment is valid for that graph and select variables to adjust for; do not adjust automatically. section 2.2.3 section 2.6
- Check positivity: each relevant confounder combination must have received the treatment at some point. section 2.5.5 section 2.9
- Estimate conditional outcomes by treatment and confounders, then average them over the confounder distribution. section 2.2.5 section 4.2.2
Kidney-stone treatments
Treatment A can look worse overall when it is used more often for difficult large-stone cases, even though it has higher recovery rates for both small and large stones. Adjusting each treatment’s size-specific recovery rates to the same patient mix reverses the misleading aggregate comparison and selects A. section 2.1.3 section 2.2
Adjustment is not a universal correction. It can estimate an intervention effect for a confounder structure, but may be biased when applied to a mediator. Missing relevant confounders also remains a central risk. With many confounders, estimating the needed conditional probabilities becomes difficult and may use machine learning with cross-fitting. section 2.5.10 section 2.9 section 4.6
