Ordinal data is qualitative, nonnumerical data whose categories have a meaningful order or rank. Unlike nominal data, ordinal labels are not interchangeable: XS, S, M, L, and XL follow an ascending size sequence. section 3.1.2 section 14.2
Use the ordering of ordinal categories when planning a visualization:
- List dataset attributes and classify ordinal variables separately from quantitative and nominal variables. section 14.2
- Choose an encoding that preserves or communicates rank; sequential or diverging color palettes can represent ordered categories. section 3.1.2
- Select a D3 scale suited to qualitative data rather than treating the labels as continuous numerical measurements. section 3.1.2
Coffee sizes
Coffee sizes such as short, tall, grande, and venti form an ordinal variable because their order matters. That ordering can guide the visual channel chosen for a chart. section 14.2
Figure 3.4 A classification of data types
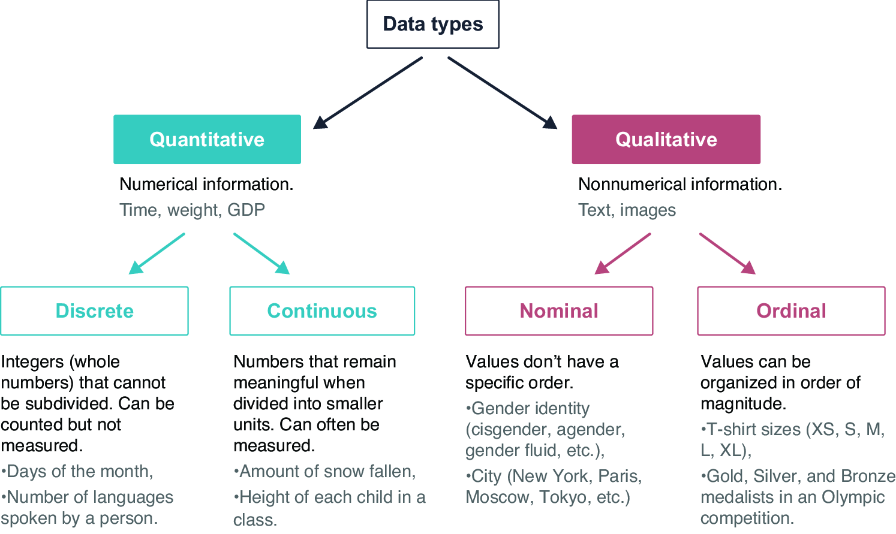
Use the data-type classification figure to distinguish ordinal categories from nominal, discrete, and continuous data. section 3.1.2