An anomaly score is a numerical estimate of how unusual a record is relative to a reference group. Unlike an inlier/outlier flag, it preserves a ranking: you can inspect the highest-scoring records first and choose a threshold later if you need labels. A score is not proof that a record is erroneous or important. Its meaning depends on the comparison group, features, and detector. section 1.1.10 section 2.1.7 section 3.3.4
Changing the reference group
A fund can look unusual among funds in its assigned segment but ordinary in another segment. Scoring it against each segment can therefore reveal a potentially poor assignment. The result is conditional on the chosen measure of similarity; a high score alone does not establish misclassification. section 1.1.10
Different detectors turn different notions of unusualness into scores:
- A z-score expresses departure from a numeric distribution; a kernel density estimate can also supply a score instead of an immediate flag. section 2.1.7
- A nearest-neighbor approach can use the mean distance to a record’s k nearest neighbors. Its scores depend on k and on how the data is prepared. section 4.11
- Histogram-based Outlier Score (HBOS) scores values according to their feature-bin counts, then sums their contributions for a row. Sparse bins can identify unusual values inside a feature’s range as well as at its extremes. section 6.2
- A cluster-based score can use distance to a cluster center. Dividing Mahalanobis distance by the average distance within that cluster makes scores across clusters more comparable; cluster size can also contribute. section 7.8.1 section 3.2.3
Check the direction and distribution before interpreting scores: some detectors give stronger outliers higher numbers, while others reverse that order. A histogram may suggest a cutoff, but often shows a continuum with no defensible boundary. If the task is to review 50 records, scores let you select the top 50 without claiming that all 50 are genuine outliers. Small reference datasets make estimates of unusualness especially unreliable. section 11.1 section 3.3.4 section 10.3
Figure 3.8 The distribution of outlier scores using FPOF on the SpeedDating dataset and KDE on the wall-robot-navigation dataset. In some cases, such as the KDE scores from the robot navigation dataset, we can identify a reasonable cutoff to separate inliers from outliers, while with the FPOF scores from SpeedDating, there is no clear cutoff.
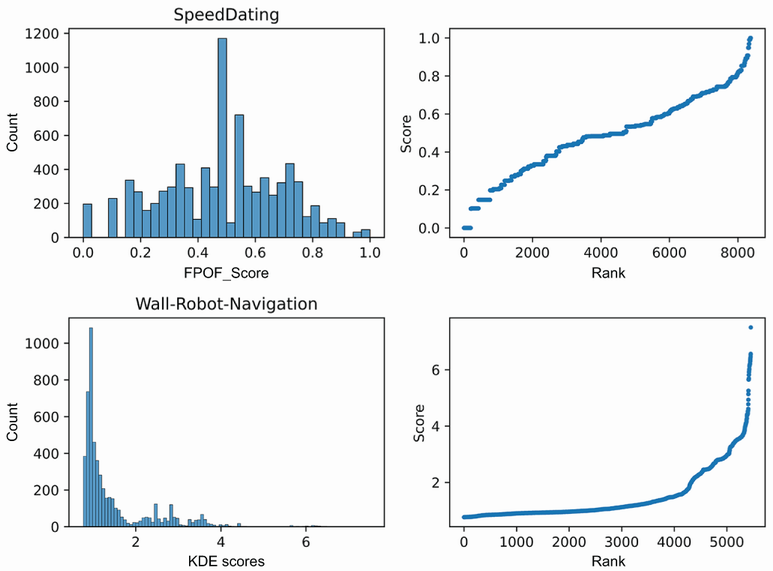
Compare score distributions with and without an apparent cutoff; the plots show why a binary label may discard information or require a judgment call. section 3.3.4
For a practical check, inspect high-scoring rows and the features behind their scores. Test whether known anomaly patterns adequately explain a record’s score; a much higher score than others in its category may warrant further investigation. When synthetic outliers provide test labels, AUROC evaluates score ranking, while precision at k addresses a fixed review budget. These checks assess usefulness without assuming every flagged row matters. section 13.2.5 section 15.3.3 section 8.5.2
Scores from different detectors are not directly interchangeable: their scales and distributions can differ greatly. To form an ensemble, retain each detector’s scores, select complementary detectors, scale scores where needed, and combine them into one score per record. Scaling is usually necessary across different detector types, but may discard information when comparable detectors already share a meaningful scale. section 14.1 section 14.5 section 14.7