A parabola is a quadratic curve used as a local surrogate for how a business metric changes with one continuous parameter. With three nearby measurements, its hump can place a maximum at an unmeasured interior value, unlike a line fitted through only two points, whose maximum stays at an endpoint. section 4.1.1
Use the curve locally rather than as a global claim about the response. A metric can have an arbitrary overall shape, but near a maximum it may resemble a parabola; measurements taken too far from that peak can break the approximation. Keeping the three parameter values close limits experiment cost while supporting interpolation. section 4.1.1
Fit and use a parabolic surrogate as follows:
- Choose three nearby values of a continuous, ordered parameter with interior values. section 4.1.1
- Randomize parameter selection and collect replicated measurements at each value; aggregate the resulting metric estimates and their standard errors. section 4.1.2
- Fit ŷ = β0 + β1x + β2x² with linear regression, where x is the parameter and y is the aggregate metric. section 4.1.3
- Evaluate the fitted curve between the measured values and select the parameter yielding its highest interpolated value. section 4.1.3
Choosing a trading threshold
Measure markout profit at thresholds 0.5, 1.0, and 1.5, then fit a parabola through the three aggregate results. Even if 1.0 is the best measured threshold, the fitted curve can estimate a more profitable unmeasured threshold within the 0.5–1.5 range. Because three measurements equal the model’s three parameters, this fit is exact at those points; that does not establish accuracy away from them. section 4.1.2 section 4.1.3
Figure 4.6 Measured values of markout_profit(threshold) and interpolations between them. When we interpolate between only two measured values, shown as filled dots in (a) and (b), the maximum profit occurs at one of the measured values. When a third measured value is added, as in (c) and (d), the maximum profit may occur at an interpolated value, shown as an unfilled dot in (c) and (d). Thus, for interpolation to be useful in estimating an optimum at an unmeasured value of threshold, at least three points must be measured.
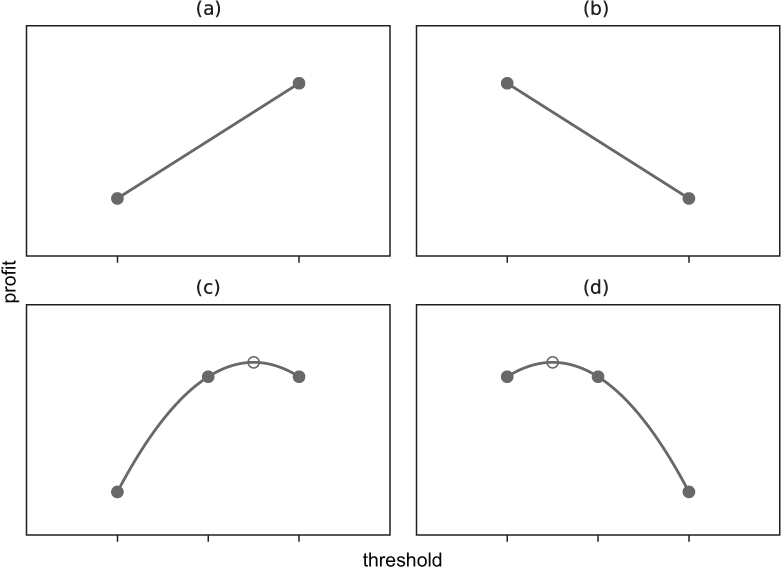
Compare the two-point case, where an endpoint wins, with the three-point case, where the interpolated parabola can peak between observations. section 4.1.1
