Patch length is the number of time steps grouped into each input patch. Each nonoverlapping patch becomes one token before embedding, reducing token count and computation while preserving longer input windows. section 6.1.1
Figure 6.2 The process of patching. Typically, each data point (circle) is a token that’s sent to the embedding layer. With patching, we group data points, and each patch becomes a token that is sent to the embedding layer.
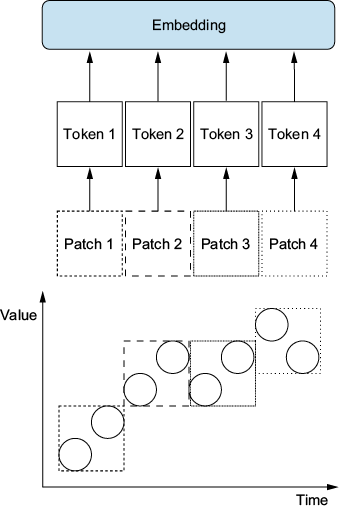
Shows how grouping multiple data points into patches replaces individual tokens before the embedding layer. section 6.1.1
Moirai selects patch lengths heuristically from data frequency: higher-frequency series receive longer patches to control computation and retain long input windows. Monthly data uses three patch lengths, each with its own embedding layer. section 6.1.1
Frequency-dependent settings
Moirai uses length 8 for yearly or quarterly data; monthly data uses 8, 16, and 32; weekly or daily data uses 16 and 32; hourly data uses 32 and 64; every-minute data uses 32, 64, and 128; every-second data uses 64 and 128. section 6.1.1
Moirai-MoE fixes one patch length across frequencies, simplifying embedding through a single input projection. TimesFM uses an input patch length of 32 and forecasts output patches of 128 steps. section 6.2.1 section 7.1.1
