A proportion expresses a share as a number out of one hundred: a percentage. It makes comparisons fairer when groups differ in size, turning raw totals into a more meaningful view of the data. section 6.3.2
Use proportions thoughtfully when presenting data:
- Normalize counts when population size could dominate the picture. Sales per customer or the percentage of residents who voted can reveal patterns that raw totals conceal. section 6.3.2
- Keep the scale consistent and treat nonlinear scales with caution, especially for a general audience. section 6.1.4
- Match the audience’s familiar units. Replacing a substantial dollar loss with a small percentage can make the result sound deceptively mild. section 6.1.4
Voter turnout
A county with more votes is not necessarily more engaged; it may simply have more people. Showing the percentage of the county’s population who voted gives sparsely and densely populated counties equal footing and makes turnout the central comparison. section 6.3.2
Figure 6.20 Instead of showing a raw number of votes from each county in the United States, it’s more insightful to show the percentage of the population in each county who voted in the election or voter turnout. A choropleth is better than bubbles for this because most of the bubbles would be roughly the same size, so it would be hard to see the regional trends. (Data source: McGovern et al. [1], combined with population estimates by the US Census Bureau released to the public in March 2020)
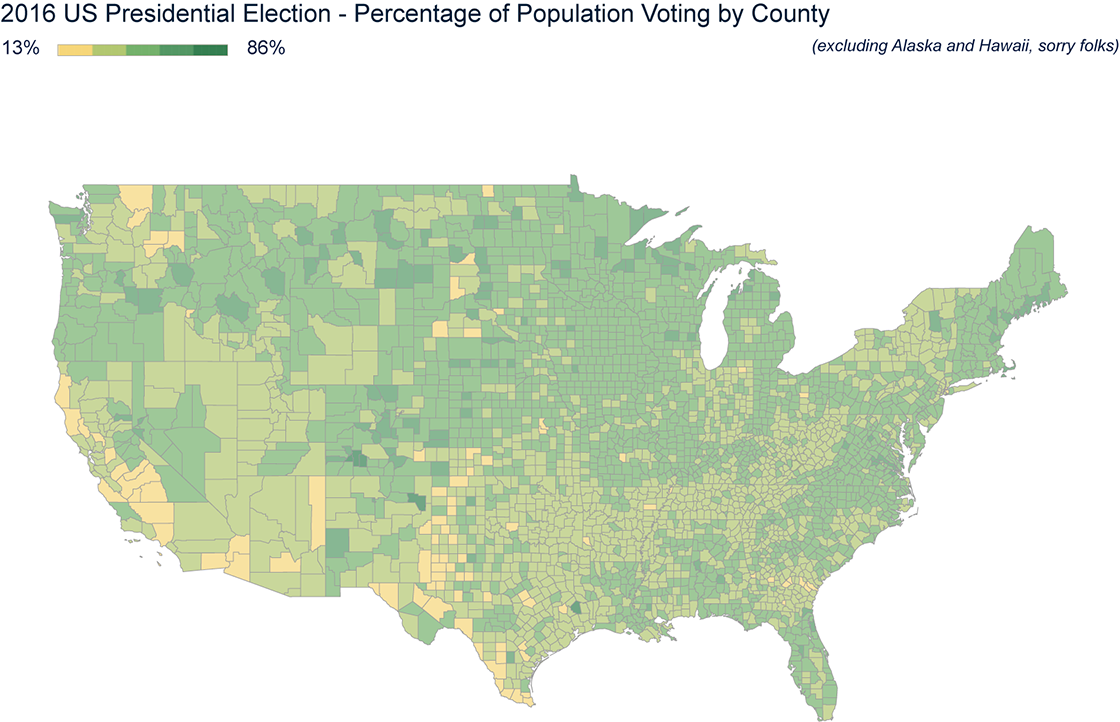
Compare raw vote totals with voter-turnout percentages to see how normalization changes the geographic story. section 6.3.2