A proportion measures the fraction or percentage of a population with a particular categorical attribute. It fits clear yes-or-no questions, such as whether someone bikes to work or plays video games. section 5.6
Keep these distinctions in view:
- Use a proportion when the outcome is categorical or binary; preserve a measurable quantity when one is available instead of forcing it into categories. section 5.6
- Write the population proportion as P and the sample proportion as p̂. For example, 55 successes among 100 people gives p̂ = 0.55. section 5.6
- For sample-proportion approximations, check the stated sample-size conditions and use standard error rather than the sample standard deviation. section 5.7
Video-game survey
Suppose 55 of 100 randomly sampled Americans play video games. Then p̂ = 55/100 = 0.55. A 95% confidence interval estimates the population proportion as 45.2%–64.8%. In Python, scipy can calculate the critical value and margin: margin = z * sqrt(p̂ * (1 - p̂) / n). Interpret the interval carefully: 95% of similarly constructed intervals would contain the true proportion. section 5.8
Figure 5.9 Modeling the sampling distribution of sample proportions, assigning different likelihoods to proportions of a sample
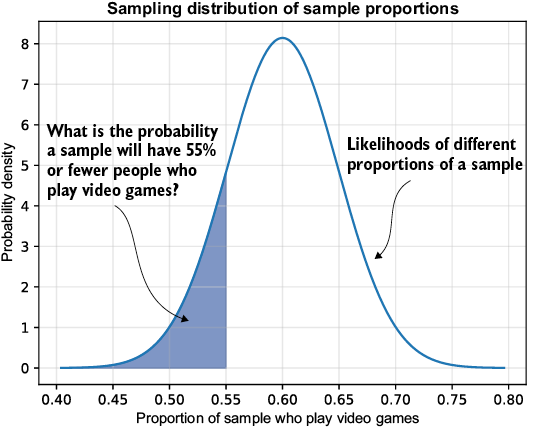
Visualizes the sampling distribution of sample proportions and the likelihood of obtaining values such as 55% when the population proportion is 60%. section 5.7