A classifier can make two different kinds of mistakes: it can place a point just barely on the wrong side of its boundary, or far into the wrong region. Simply counting mistakes treats these cases equally. The perceptron error function gives the bigger mistake a bigger penalty, helping compare classifiers and guide improvement. section 5.12
Figure 5.14 The two classifiers misclassify the point. However, the classifier on the right made a much bigger mistake than the classifier on the left. The point on the left is not far from the boundary, and thus, it is not very far from the sad zone. However, the point on the right is very far from the sad zone. Ideally, we would like an error function that assigns a higher error to the classifier in the right than to the classifier in the left.
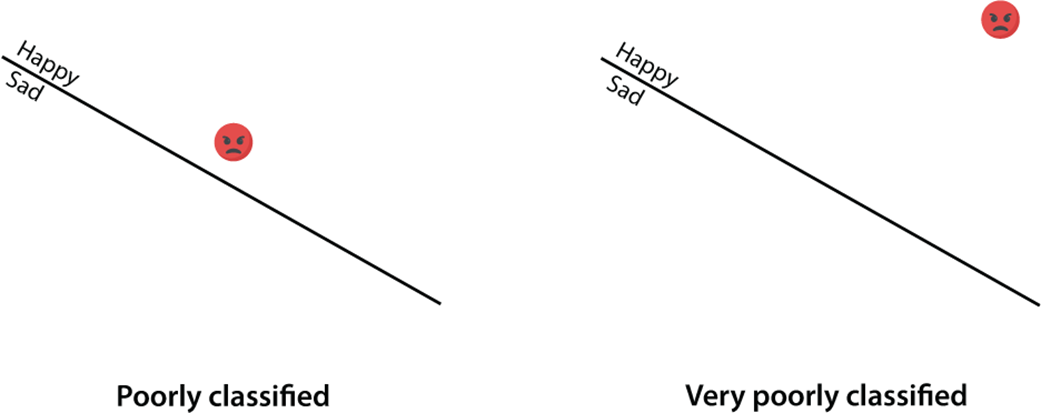
This picture contrasts a near-boundary mistake with a much larger mistake farther from the boundary. section 5.12
Start with the perceptron score. Points on the boundary have score 0. Scores are positive in the positive zone and negative in the negative zone. A score with small absolute value lies close to the boundary; a score with large absolute value lies farther away. section 5.12
For one labeled point, the perceptron error works as follows:
- If the prediction is correct, assign error 0. section 5.12
- If the prediction is wrong, assign the absolute value of its score. section 5.12
- For a dataset, add the point errors and divide by the number of points to obtain mean perceptron error. section 5.19
Comparing two sentence classifiers
Represent alien sentences by the counts of “Aack” and “Beep.” One classifier misclassifies “Beep,” with score −2, so its error is 2; it also misclassifies “Aack beep beep aack aack,” with score 3, so its error is 3. Its mean perceptron error is 1.25. A second classifier gets all four sentences right, so its mean error is 0 and it is the better classifier for this dataset. section 5.12
Table 5.4 Our dataset of four sentences with their labels. For each of the two classifiers, we have the score and the prediction.
|
Sentence (xaack, xbeep)
|
Label
y
|
Classifier 1 score
1xaack + 2xbeep – 4
|
Classifier 1 prediction
step(1xaack + 2xbeep – 4)
|
Classifier 1 error
|
Classifier 2 score
–xaack + xbeep
|
Classifier 2 prediction
step(–xaack + xbeep)
|
Classifier 2 error
|
|
(1,0)
|
Sad (0)
|
–3
|
0 (correct)
|
0
|
–1
|
0 (correct)
|
0
|
|
(0,1)
|
Happy (1)
|
-2
|
0 (incorrect)
|
2
|
1
|
1 (correct)
|
0
|
|
(1,3)
|
Happy (1)
|
3
|
1 (correct)
|
0
|
2
|
1 (correct)
|
0
|
|
(3,2)
|
Sad (0)
|
3
|
1 (incorrect)
|
3
|
–1
|
0 (correct)
|
0
|
|
Mean perceptron error
|
|
1.25
|
|
0
|
|||
The score, prediction, point error, and mean error for two classifiers are shown side by side. section 5.12
This measure avoids using perpendicular distance to the boundary, whose square root makes derivatives more complicated. Instead, score magnitude provides a simple penalty that still distinguishes small from large misclassifications. During the perceptron algorithm, mean perceptron error is recorded at each epoch to track progress and decide when to stop. section 5.12 section 5.13
A small implementation first computes the score with a dot product plus bias, turns it into a prediction with a step function, then returns either 0 or the score’s absolute value. Averaging that result across the dataset produces the value tracked while repeated perceptron updates improve the classifier. section 5.19 section 5.20

