A point scale maps each value in a discrete domain to an evenly spaced position in a continuous range. In D3, create one with d3.scalePoint(). Unlike a band scale, it has zero bandwidth, so it supplies positions rather than widths. section 6.4.3 section 6.6
Use a point scale when categories, ranks, or dates need a shared set of anchor positions. Set domain() to the discrete values and range() to the available chart space. Use padding() to add blank space at both ends; its factor ranges from 0 to 1 and is measured against the spacing between adjacent points. section 6.4.3 section 6.5
Position categories for distribution charts
A box-plot x-axis can map Female and Male across the inner chart width with padding(0.5). A violin plot similarly maps role names across the x-axis with padding(0.7), while separate linear scales position salaries and calculate violin widths. The point-scale position becomes the center from which each violin extends. section 6.4.3 section 6.5
Use points beyond a horizontal category axis
Point scales can place years horizontally and ranking values vertically for curves, or map months to evenly separated angles around a circle. For radial month axes, the resulting angle feeds sine and cosine calculations for line endpoints. section 8.6.3 section 14.5.1
Figure 6.13 D3’s point scale is similar to the band scale but with zero bandwidth. Its domain consists of a discrete list of elements distributed over a continuous range.
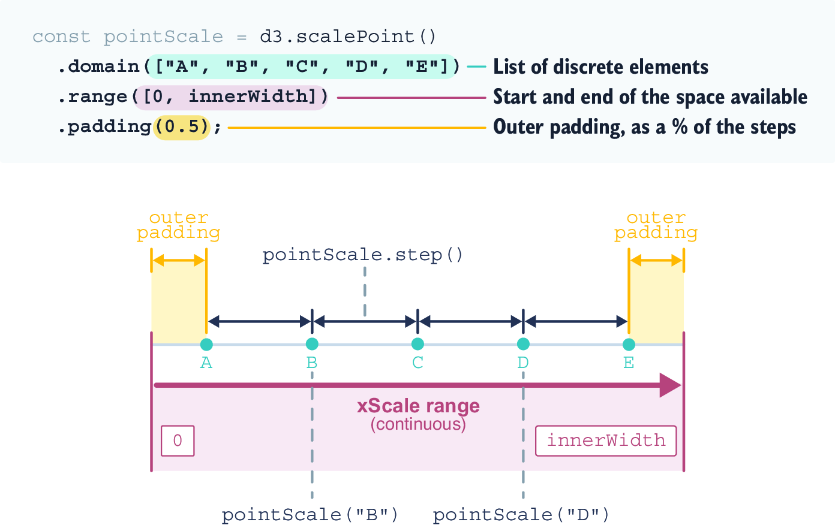
Inspect the relationship between a discrete domain, a continuous range, and zero bandwidth. section 6.4.3
