A polarity map helps a group manage an ongoing both/and tension rather than force an either/or choice. It makes the benefits and risks of two interdependent poles visible, so people can recognize when remaining on one side is producing harmful effects and agree when to shift attention to the other. section 10.2 section 10.7
Draw one pole on the left and the other on the right. Give each pole an upside and a downside, creating four quadrants: L+, L−, R+, and R−. Side placement is arbitrary. The downside of one pole commonly points toward the upside of the other: broad, end-to-end modeling can leave questions and assumptions, while detailed modeling can answer them. section 10.2.1 section 10.7
Build the map collaboratively in a sequence that makes competing perspectives discussable:
- Name a genuine polarity: two approaches that must both be managed over time, not a problem that can be solved by selecting one side. section 10.7
- Fill in the positive and negative effects of each pole, thinking in extremes: what happens if the group only follows this side? Starting with downsides is often easier; begin with the minority pole when needed to ensure it is heard. section 10.2.1 section 10.7
- Identify observable, context-dependent signals that indicate the group is stuck or becoming imbalanced. Describe observations neutrally rather than attaching interpretations. section 10.2.2 section 10.3.3
- Choose actions or heuristics that move the group toward the other pole. An action may address one signal or several; revisit the map as the group learns which responses work. section 10.2.2 section 10.7
Deep versus Wide
A modeling group may be split between going deep into details and going wide across an end-to-end flow. Map the upsides and downsides of both. If participants are confused by a high-level map, signals may call for brainstorming what is missing or modeling another scenario. If the group is trapped in detail, shift back toward a wider view. The aim is not a permanent midpoint, but access to the useful effects of both approaches. section 10.2.1 section 10.2.2
Use the map when a disagreement is being treated as a contest over who is right. First make the polarity explicit—for example, place its two poles at opposite ends of a line and ask where people stand, or offer a neutral climate report. Once the group recognizes the tension, decide together whether to map it or have a facilitator manage it during the session. section 10.3.2 section 10.1.4
A polarity-mapping session can begin with a check-in: what happens when people go too far toward either pole, and how do they avoid it? Small mixed groups can list positives first, then negatives, compare maps, name their fear of failing to manage the polarity, and identify the outcome they want. Signals and actions usually need more facilitation than the four quadrants. section 10.3.3
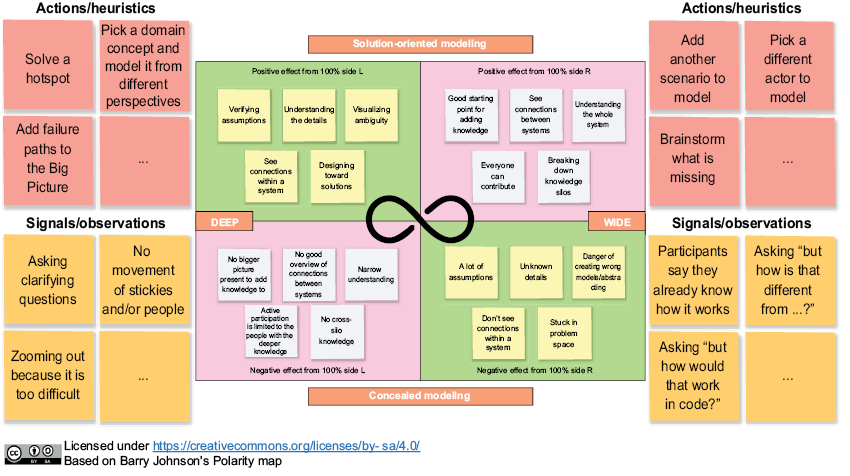
Use the completed Deep-versus-Wide map as a reference for how quadrants, signals, and actions combine into one shared management aid. section 10.2.2