Predictive analytics uses statistical algorithms, machine learning, and data analysis to identify patterns and estimate future events. In cybersecurity, models combine historical incidents, threat intelligence, and current vulnerabilities to forecast potential security incidents. The aim is to give teams time to act before a threat escalates, rather than measure it only afterward. section 10.1 section 1.3
Turn a forecast into a decision:
- Use a risk exposure index (REI) to summarize current risk from vulnerabilities, exploitation likelihood, and business effect; use a predictive threat index (PTI) to estimate future incident probability from attack history, threat intelligence, and monitoring. section 10.2
- Prioritize likely attack vectors and high-risk vulnerabilities, then pair monitoring with preventive controls and policies. A forecast alone does not prevent an incident. section 10.2 section 1.3
A measurable risk-management goal
A financial services company facing malware attacks starts with an REI of 80%, a PTI indicating a 60% likelihood of a malware attack within six months, 50 malware incidents per month, and a 12-hour response time. It targets an REI below 40%, a PTI below 20%, 15 monthly incidents, and a four-hour response time. Teams prioritize patching vulnerabilities likely to be targeted and monitor network traffic and user behavior; after six months, the REI falls to 35%. The useful report compares these measures with the targets, not just the number of alerts generated. section 10.2.3
An implementation can bring incident records and threat intelligence into Elastic Stack for pattern analysis and dashboards, while Wazuh monitors activity and integrates with predictive models. Analysts still need to configure data pipelines, queries, alerts, and thresholds for the organization’s risk tolerance. Reassess forecasts as threats and vulnerabilities change. section 10.2.5 section 10.2
Figure 10.1 The left side shows risk exposure and predictive analytics before implementing improvements. The right side shows the situation afterward.
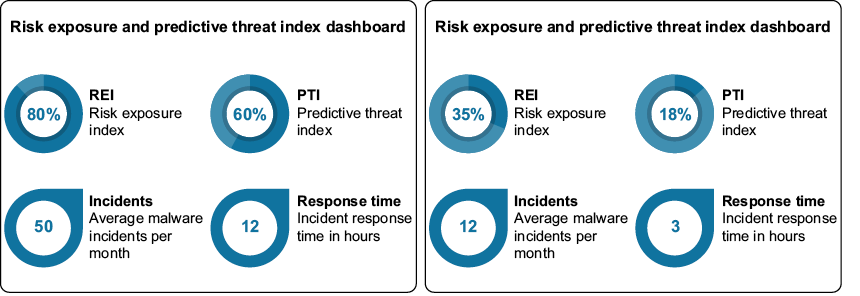
Compare the before-and-after dashboard to see whether predictive work accompanies improvement in risk and response measures. section 10.2.3


