Quality control monitors process variation and output defects against quality requirements. Control charts distinguish ordinary variation from signals that require investigation, while specification-based measures assess whether a process can meet its targets. section 14.1.1 section 14.1.12
Use the measure and chart that match the data and decision:
- Set a center line with upper and lower control limits. Three standard deviations is conventional, but two-sigma limits can detect smaller shifts sooner and four-sigma limits can accommodate greater inherent variation. section 14.1.1
- Track the proportion of defective items with a p-chart when sample sizes may vary. section 14.2.1
- Track the count of defective items with an np-chart when every sample has the same size. section 14.2.2 section 14.1.7
- Count multiple defects with c-charts, or normalize them per inspected unit with u-charts when sample sizes vary. section 14.1.8
- Use EWMA charts when recent observations should receive more weight and small shifts or gradual trends need earlier detection. section 14.3.5
Process capability indices compare process spread with specification width. Cp describes potential capability assuming perfect centering; Cpk adjusts the assessment for the actual process mean, making it more realistic when the process is off-center. section 14.1.12
Building an attribute control chart
Load the orange-juice batch data with pandas, calculate each batch's defective proportion as D divided by size, average those proportions for p-bar, and compute sigma as sqrt(p-bar × (1 − p-bar) / size). Plot p-bar with UCL and LCL at three sigma. For constant samples of 50 cans, an np-chart instead plots D directly; tightening its limits to two standard deviations highlights a pair of points above the UCL for investigation. section 14.2.1 section 14.2.2
>>> import pandas as pd
>>> print(oj.info())
<class 'pandas.core.frame.DataFrame'>
RangeIndex: 64 entries, 0 to 63
Data columns (total 3 columns):
 #   Column  Non-Null Count  Dtype
---  ------  --------------  -----
 0   sample  64 non-null     int64
 1   D       64 non-null     int64
 2   size    64 non-null     int64
dtypes: int64(3)
memory usage: 1.6 KB
None
Inspect the pandas data-frame structure before calculating proportions and control limits. section 14.2.1
Figure 14.9 This EWMA chart displays the exponentially weighted moving average of piston ring diameters across 40 samples. The chart shows how the process mean evolves over time, with recent data points having more influence on the chart’s trajectory than older ones. The CL represents the overall EWMA mean, whereas the UCL and LCL indicate the expected range of variation. Data points within these limits suggest the process is under control, whereas any point outside may signal a shift or trend that requires further investigation.
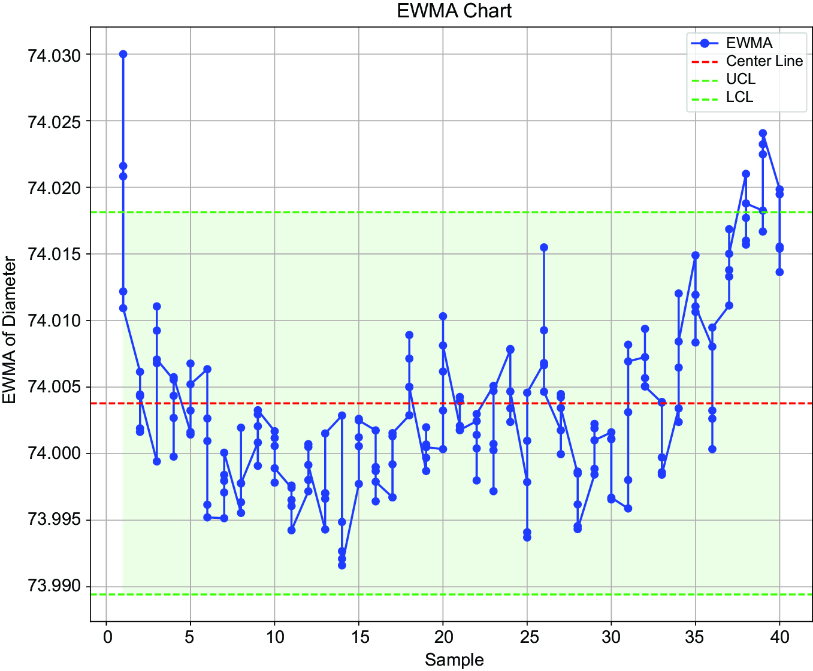
Compare EWMA values, the center line, and control limits while monitoring piston-ring diameters across 40 samples. section 14.3.5
