A quartile is a value that divides an ordered dataset into four ranges containing approximately 25% of the observations each. The lower quartile marks the point below which 25% of values fall, the median divides the data in half, and the upper quartile marks the point below which 75% fall. section 7.1.2
Quartiles support interquartile-range filtering when data is skewed or contains outliers. Keeping values between the lower and upper quartiles reduces noise before calculating variance and standard deviation. section 7.1.2
Filtering connection timing data
For grouped network events, calculate lower and upper quartiles for time_diff_sec, drop rows outside those bounds, and then compute grouped standard deviation, variance, and connection counts. section 7.1.2
Figure 7.4 Quartiles for a nonnormal distribution
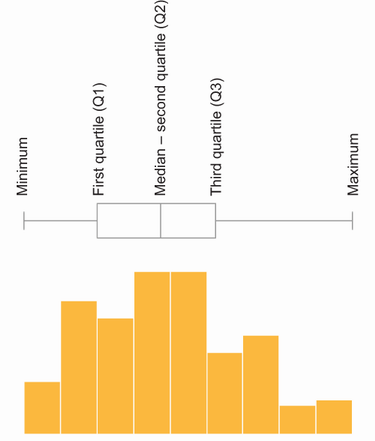
Use the quartile box plot to inspect quartile positions in a nonnormal distribution. section 7.1.2



