A trend line, or regression line, is a straight line fitted to data to represent the relationship between an independent variable and a dependent variable. It aims to stay as close as possible to all data points, like a subway route designed to minimize walking distance to many offices. section 8.11
A least-squares regression line passes through the intersection of the feature means. To calculate it, find the means, measure each value’s distance from its mean, square the independent-variable distances, multiply paired distances, and use the resulting sums to calculate the slope and intercept. section 8.11
Predicting diamond prices
Using carat as x and price as y, the data is plotted, and carat values are scaled by 1,000 to simplify manual calculations without changing relationships. The fitted line is then evaluated at minimum and maximum carat values to produce predicted prices. A Python implementation returns the intercept, slope, and two endpoints for plotting the line. section 8.11
A fitted line should be tested on previously unseen examples rather than the training data. Comparing its predictions with actual prices supports accuracy measurement with R², which describes variance between actual and predicted values. section 8.12
Figure 8.10 Intuition of regression lines
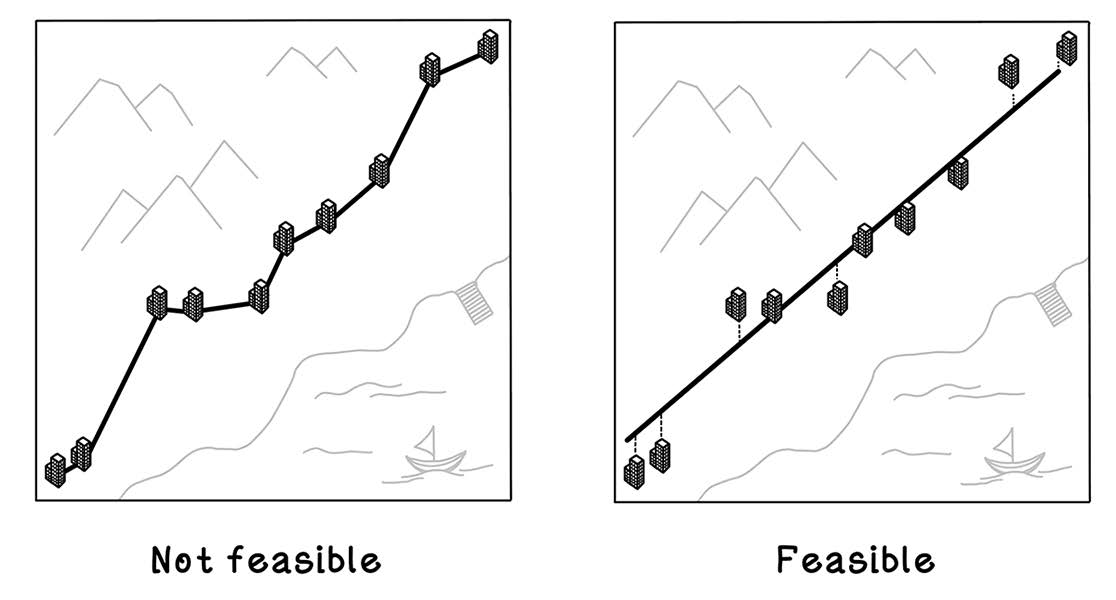
Use the subway-route visual to see why the best line balances its distance from many points rather than passing through every point. section 8.11



