A trend line, or regression line, is a straight-line representation of the relationship between an independent variable x and a dependent variable y. Linear regression estimates the intercept and slope so the line models the relationship while minimizing differences between observed and predicted values. section 4.1.1 section 4.1.2
Interpret the line through its parameters and residuals:
- The intercept β0 is the predicted response when x equals zero. section 4.1.1
- The slope β1 describes the change in the response for each one-unit change in x. section 4.1.1
- Residuals are the differences between observed y values and the line’s predicted values; fitting minimizes their sum of squares. section 4.1.1 section 4.1.2
- For multiple predictors, the line generalizes to a hyperplane in multidimensional space. section 4.1.2
Reading a plotted regression line
A scatter plot can show eight observed x and y pairs alongside their fitted line. The line represents predicted y values for given x values, while R-squared reports the proportion of response variance explained by the predictor. Positive, negative, or neutral scatter patterns indicate how the variables move together. section 4.1.1 section 4.1.2
Figure 4.1 A scatter plot that displays eight data points, their respective x and y coordinates, and a regression line. The data points represent the observed data (for instance, when x equals 202, y equals 288, which has been highlighted and magnified). The regression line ties back to a simple linear regression that was fit on the data, where a response variable called y, which runs along the y axis, was regressed against a predictor called x, which runs along the x axis. It represents the linear equation at the top that can be derived from the model output, which is to say, it is also a representation of the predictions for y given x. R-squared is one of several metrics contained in the model output; it represents the percentage of variance in the response variable that can be explained by changes in the predictor.
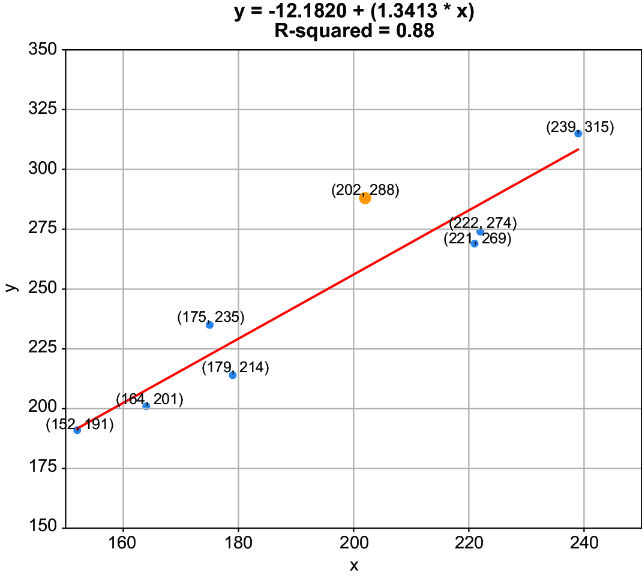
Inspect the observed coordinates, fitted line, predicted values, and R-squared interpretation together. section 4.1.1



