Research means spending time with users to understand their mental models: what they expect, what they recognize, and how they explore an unfamiliar visualization. section 7.2.2
A practical research session can include:
- Ask many questions about what users are looking for and what they are used to seeing. section 7.2.2
- Watch users try both an unfamiliar visualization and one they already know. section 7.2.2
- Record the session with permission, so observations can be reviewed without frantic note-taking. section 7.2.2
A dashboard as a research artifact
A dashboard with selectable indicators and generation filters gives users several ways to explore the same data. Watching where they click—and what they expect to happen—reveals their mental model. section 7.2.2
Figure 7.8 The interactivity in this dashboard allows the user to explore multiple ways of segmenting the data set, and as a bonus, it packs a ton of information into a compact space: we learn about the popularity of doctors measuring various indicators themselves across all respondents and respondents broken down by generation, and then we also get a separate breakdown of total respondents by generation. You can interact with it yourself or download it from Steve’s blog at https://www.datarevelations.com/howmany/. (Steve Wexler, used with permission)
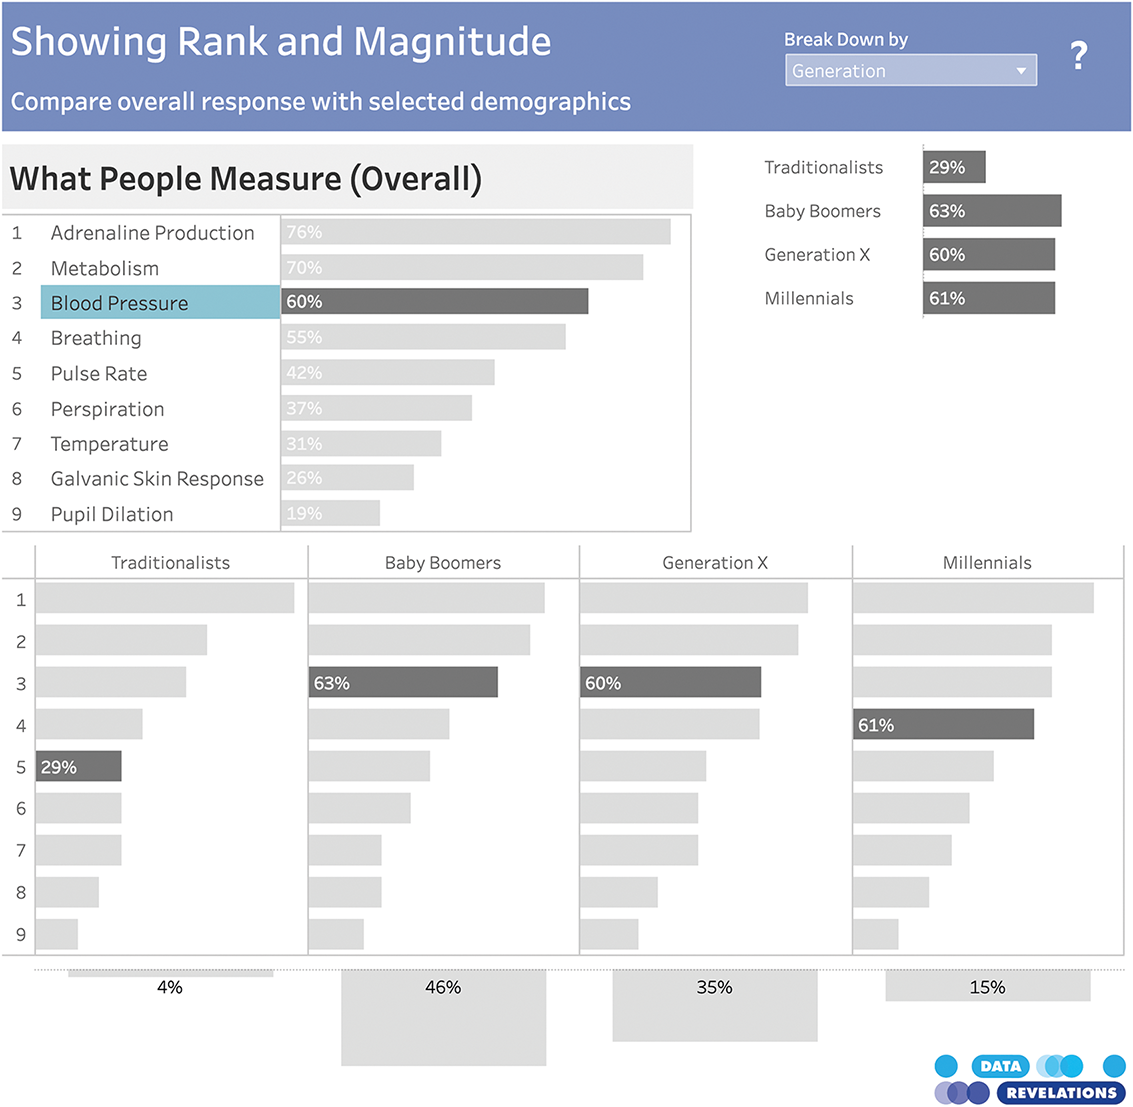
Explore the interactive dashboard as a concrete artifact for observing how users understand selections, filters, and compact data displays. section 7.2.2