Sample size is the number of observations or participants included in a statistical sample. It affects whether an analysis can detect an effect and whether its results support responsible inference. section 4.2.2 section 4.4
Choose and interpret sample size with these considerations:
- Estimate the minimum sample size required by the chosen statistical test, effect size, desired power, and alpha level. section 4.2.2
- Recognize that changing alpha or sample size changes t-values, p-values, and the likelihood of detecting statistically significant results. section 4.2.2
- Check whether the dataset fits the test’s assumptions; tests designed for relatively small samples may not produce meaningful results on millions of records. section 4.4 section 5.1.2
- Protect people in reports by suppressing or combining groups with fewer than five individuals, especially across demographic breakouts. section 8.3.3
Planning a two-sample t-test
Use an a priori power analysis for a medium effect size of 0.5, 80% power, and alpha = 0.05. Then recalculate at alpha = 0.01 and 0.001, divide the recommended total sample between groups, and compare the resulting t-tests. section 4.2.2
from statsmodels.stats.power import TTestIndPower     #1

pwr = TTestIndPower()     #2
sample = pwr.solve_power(effect_size = 0.5,
     power = 0.8,
     alpha = 0.05)
print(sample)
A compact Python listing calculates the required total sample for an independent-samples t-test using statsmodels. section 4.2.2
Figure 8.13 An employee engagement survey with multiple breakouts can accidentally deanonymize individuals in groups with few members. For example, the sales department has one EEOC group with n=1, making it easy to identify the person and their satisfaction.
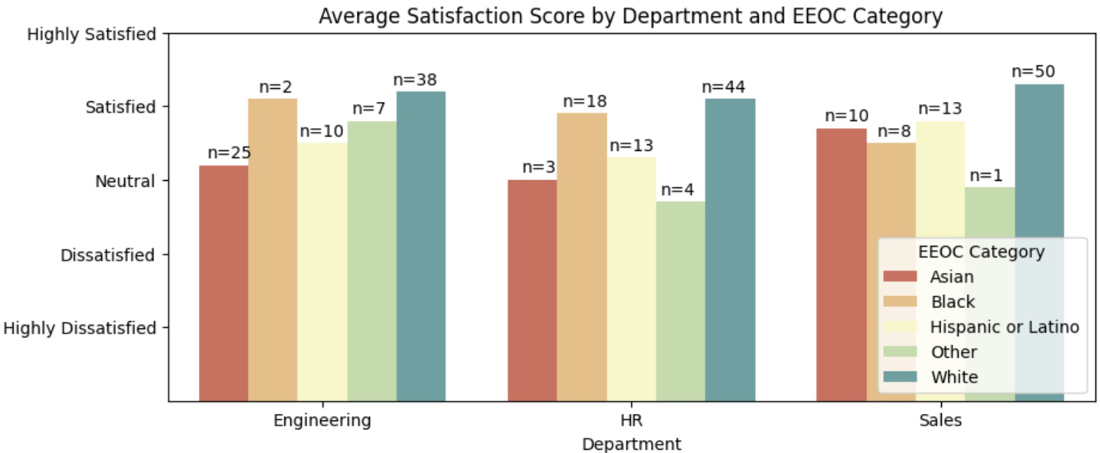
A figure illustrates how small subgroup counts, including n=1, can expose employee identities and responses. section 8.3.3


