Sample size is the number of observations in a sample, written as n. It is different from population size, written as N. If six dorm residents are randomly chosen from 64 residents, then n = 6 and N = 64. The sample is used to estimate something about the larger population, such as average sleep. section 2.6
A larger n can capture more variation, but size alone does not make a sample trustworthy. Selection should be as random and unbiased as possible, and timing and context matter: sleep measured during finals may not represent ordinary weeks. Even seemingly complete historical records can be samples when future conditions may differ. section 2.6
For sample means, increasing n reduces the standard deviation of the sampling distribution: σx̄ = σ/√n. In plain English, averages from larger samples tend to vary less from sample to sample. When the population is not normal, a sufficiently large sample lets the sampling distribution of means approximate a normal distribution. section 5.1
Figure 5.2 Increasing the sample size n narrows the bell curve and decreases uncertainty in the sample means.
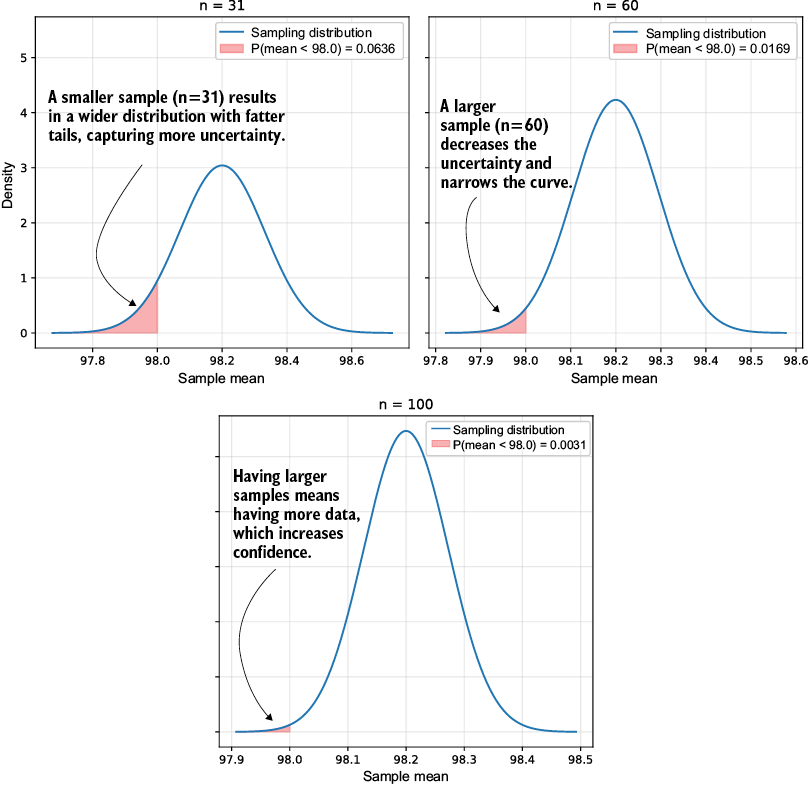
Compare n = 31, 60, and 100: the bell curve for sample means narrows as n grows, making an average farther from the population mean less likely. section 5.1
Sample size changes common statistical decisions:
- Use a larger sample to narrow a confidence interval without lowering its confidence level. For a mean of 7.5 and standard deviation of 2.5, changing n from 100 to 1000 produces tighter intervals at the same confidence levels. section 5.4
- Use the t-distribution for samples of 30 or fewer when the population can reasonably be assumed normal. Its degrees of freedom are n − 1, and smaller n produces fatter tails to reflect greater uncertainty. section 5.5
- Treat 31 or more as a rough rule-of-thumb threshold in these examples: the t-distribution approaches the normal distribution, and larger samples support central-limit reasoning for nonnormal populations. section 5.1 section 5.5
Choosing n under real constraints
A study might have only 12 satellites, 5 bridges, or six available sleep-tracking watches. More observations would generally reduce uncertainty, but cost and feasibility can limit n. A small n is not useless; it calls for methods that account for its added uncertainty and careful interpretation of what the sample can represent. section 2.6 section 5.5


