Seaborn is a Python statistical visualization library that offers a high-level API on top of Matplotlib, emphasizing attractive plots with little customization. section 11.0 section 11.16
Choose a function according to the insight you want to investigate:
- Use sns.relplot for relationships among numeric columns, including scatter and line plots. section 11.16
- Use sns.catplot for relationships involving categorical columns, such as city-based temperature comparisons and boxplots. section 11.16
- Use sns.displot to examine distributions, including overall or category-separated histograms. section 11.16
- Use sns.regplot to visualize regression models. section 11.16
Compare taxi distance and fares
After loading January and July 2020 taxi records, derive year, month, and day columns, filter to the target months, reset the index, and sample 1% of the rows. Then plot trip distance against total amount, coloring points by passenger count: sns.relplot(x='trip_distance', y='total_amount', data=df, hue='passenger_count'). Extend the exercise with daily line plots and monthly fare boxplots. section 11.17 section 11.18
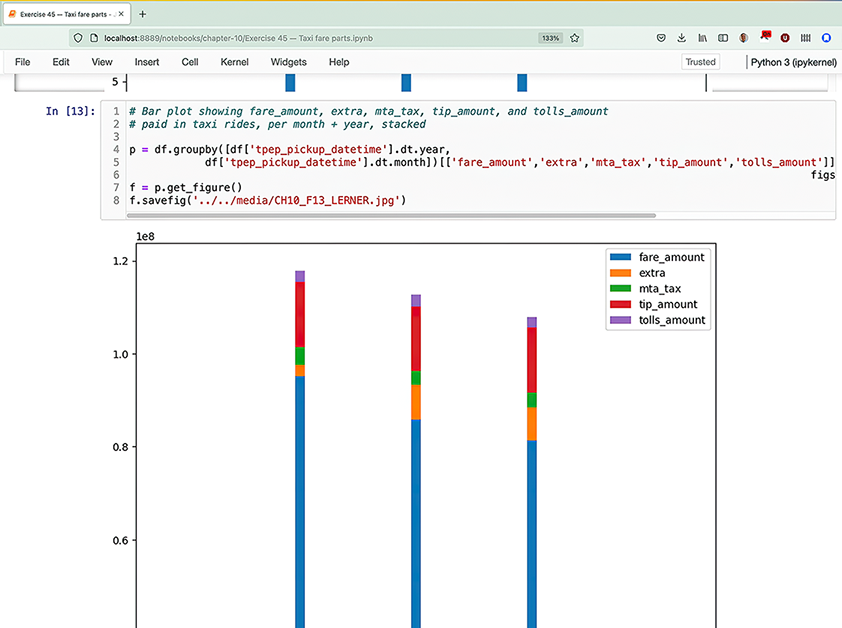
Inspect how a Jupyter notebook can keep data, code, and rendered plots together for sharing and feedback. section 11.0


