A similarity metric is a numerical rule for quantifying how similar two data points are. In Gaussian processes, a kernel uses this idea to estimate how likely two inputs are to have similar labels. section 13.0
Comparing houses
A door-color rule assigns similarity 1 to houses with matching front-door colors and 0 otherwise. That metric misleads price prediction because house size matters more than door color. A better metric includes relevant factors such as location and living area. section 13.0
The RBF kernel converts the difference between two input values into a covariance between 0 and 1. Small differences produce high covariance; large differences produce low covariance. This works naturally when nearby values imply similar outcomes, but can fail when data has meaningful structure that raw value differences do not capture. section 13.2
Structured data exposes important limitations:
- Images can be represented as 784-element tensors of pixel values, yet value-based similarity may not capture visual similarity between handwritten digits. section 13.2.2
- A large RBF length scale makes higher covariances more likely, but does not by itself provide a representation suited to image structure. section 13.2.2
Figure 13.1 The covariance between houses computed by an inappropriate kernel. Because it looks only at the color of the front door, this kernel doesn’t produce appropriate covariances.
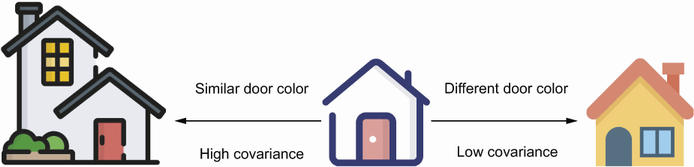
Compare how an inappropriate door-color kernel assigns covariance between houses. section 13.0