liveBook · Manning

Similarity metric

As explained in Grokking Machine Learning

A numerical measure of the closeness between two data points.

A similarity function assigns a value to a pair of points to indicate how close or different they are. In the RBF example, similarity decreases as distance increases: similarity(p, q) = e^−distance(p,q)². These values can serve as added features, helping an SVM separate data that a straight boundary cannot. section 11.3

Comparing points on a line

For points at −1, 0, and 1, the similarity of the point at −1 to those three points is 1, 0.368, and 0.018. Adding a column of such values for each point creates features that can make the labeled data linearly separable. section 11.3

Figure 11.26 Two points that are close to each other are defined to have high similarity. Two points that are far away are defined to have low similarity.
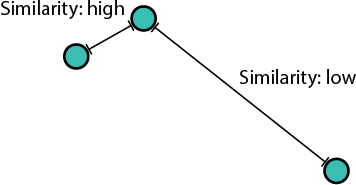
The diagram contrasts high similarity for nearby points with low similarity for distant points. section 11.3


How Grokking Machine Learning covers it

How deep it goes
Defines closeness through distance, gives an exponential formula, and defers the full theory of kernels and feature maps.
Examples
Uses one- and two-dimensional labeled datasets, distance-based similarity values, and added similarity columns.
What you can do after
Apply similarity values as added features to classify nonlinear data with an SVM.
How it connects
Connects similarity functions to radial basis function kernels, feature maps, and support vector machines.

Also explained in

Compare how 10 books explain similarity metric →

Related concepts

This explainer was generated by Manning's knowledge graph from the text of Grokking Machine Learning. The section links point to the parts of the book it draws on.