A similarity metric quantitatively compares objects or representations. In centroid-based clustering, distance provides the comparison: smaller distance from a centroid means greater similarity. section 2.3 section 2.2
Common distance-based similarity choices include:
- Euclidean distance measures the straight-line path between points. section 2.3
- Chebyshev distance uses the largest coordinate difference. section 2.3
- Manhattan distance follows grid-like paths along perpendicular axes and uses the L1 norm. section 2.3
- Cosine distance compares vectors through their dot product and magnitudes. section 2.3
The selected metric changes similarity scores and can therefore change clustering results. In t-SNE, similarity is measured both in the original high-dimensional space and in the lower-dimensional representation. section 2.2 section 6.4
Figure 2.4 Centroid-based clustering methods create a centroid for the respective clusters, and the similarity is measured based on the distance from the centroid. In this case, we have five centroids; hence, we have five distinct clusters.
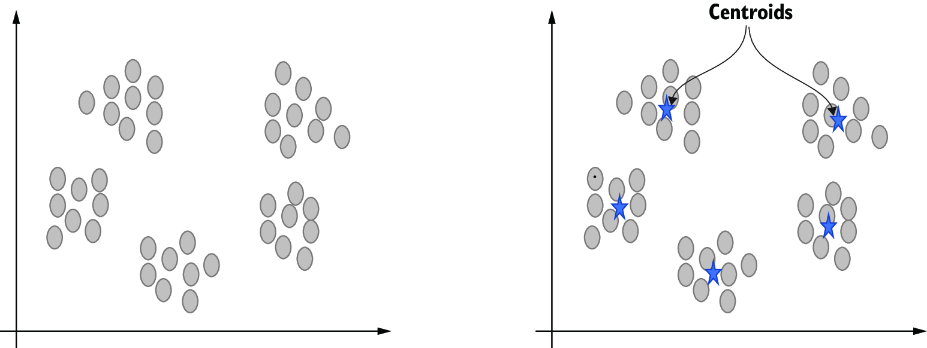
Use the centroid diagram to see similarity represented by each point’s distance from its cluster centroid. section 2.3
Figure 2.5 Euclidean distance, Chebyshev distance, Manhattan distance, and cosine distance are the primary distance metrics used. Note how the distance is different for two points using these metrics. In Euclidean distance, the direct distance is measured between two points, as shown by the first figure on the left.
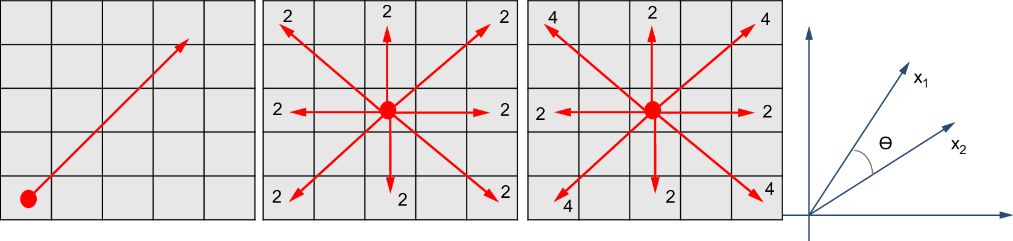
Compare how Euclidean, Chebyshev, Manhattan, and cosine metrics assign different distances to the same pair of points. section 2.3