An affinity matrix is a matrix whose entries quantify pairwise similarity between data points. Replacing adjacency-matrix connection values with similarity weights produces values from 0 for complete dissimilarity to 1 for complete similarity, with intermediate values representing degrees of affinity. section 5.3.1
Within graph-based clustering, the matrix connects similarity measurements to the structures used for spectral analysis:
- Represent data points as graph nodes and use stronger edge weights for more similar points. section 5.3 section 5.3.1
- Use the affinity matrix alongside eigenvalues, the degree matrix, and the Laplacian matrix to map data into a lower-dimensional space for clustering. section 5.3
- Interpret affinity-based clustering through connectivity rather than location, making it useful for complex shapes that k-means may separate incorrectly. section 5.3 section 5.9
From graph connections to similarity weights
Start with a graph in which nodes represent data points. An adjacency matrix records whether nodes are connected, whereas an affinity matrix replaces those binary connection values with similarity weights: highly similar points receive larger values, and dissimilar points receive smaller values. A practical exercise is to draw a graph and derive its adjacency and degree matrices before considering the affinity representation. section 5.3.1
Figure 5.4 A graph is a simple representation of data points. The points or nodes are connected by edges if they are very similar (left). The weight is higher if the similarity between data points is high; for dissimilar data points, the weight is less (right).
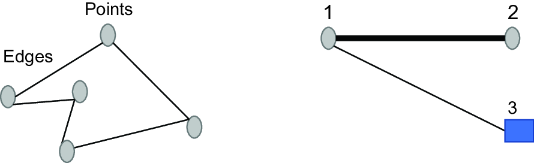
Use the graph illustration to connect nodes, edges, and edge-weight magnitude with the entries of an affinity matrix. section 5.3.1


