Spectral clustering groups data points by their affinity—how strongly they are connected—rather than by location alone. It is useful when clusters have complicated shapes. For example, the inner and outer rings of a circular dataset form two distinct groups even though a distance-based split may mix them. section 5.3
This differs from k-means, which groups points around cluster centers. In spectral clustering, connectivity drives the grouping: points may belong together because they are linked through a pattern, not because they occupy a compact region around a centroid. The method does not require clusters to have a spherical shape. section 5.3 section 5.3.2
Figure 5.3 We can have a complex representation of data points that need to be clustered. Observe the doughnut shape (left). An explanation can be that the dots in a square are a part of the same cluster as what would be based on the distance only, but clearly, they are not part of the same cluster (middle). We have two circles here. The points in the inner circle belong to one cluster, whereas the outer points belong to another cluster (right).
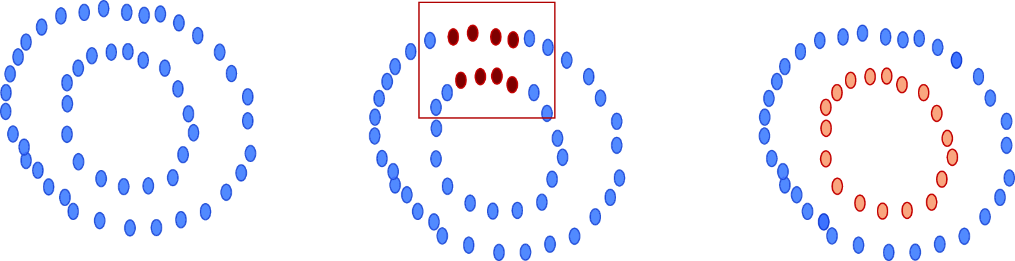
The concentric-circle diagrams show why nearby points are not necessarily in the same cluster: the inner ring and outer ring are separate groups. section 5.3
The graph-based process moves from relationships between points to a space where they can be clustered:
- Construct adjacency and degree matrices for the dataset, then use them to calculate a Laplacian matrix. section 5.3.2
- Find the k eigenvectors corresponding to the k smallest eigenvalues of the Laplacian. section 5.3.2
- Use the matrix formed by those eigenvectors to cluster the points in k-dimensional space. In a simple two-cluster illustration, positive and negative values of the resulting Fielder vector distinguish the groups. section 5.3.2
These steps explain what the algorithm uses, but a practical Python workflow need not calculate every matrix by hand. The worked comparison uses scikit-learn on 2,000 points generated with `make_circles`, fits both k-means and spectral clustering, and plots their labels on the same data. section 5.3.2 section 5.4
spectral = SpectralClustering(n_clusters=2, affinity='nearest_neighbors', random_state=5)
sc_clustering = spectral.fit(data)
plt.scatter(data[:,0], data[:,1], c=sc_clustering.labels_, cmap='prism', alpha=0.5, edgecolors='g')
The Python listing fits `SpectralClustering` with two clusters and `affinity='nearest_neighbors'`, then colors a scatter plot by the fitted labels. section 5.4
Check the shape of the result
On the circular dataset, the k-means labels overlap the two rings, while spectral clustering separates them. Plot both outputs rather than judging a clustering solely from its labels; then change the generated data and compare again. Spectral clustering is also a candidate for image segmentation, speech analysis, text analytics, and entity resolution, but its matrix operations can require substantial computation, making dataset size a practical consideration. section 5.4 section 5.3.2 section 5.9
