Specificity asks a simple question: among the cases that are actually negative, how many did the classifier correctly label negative? It is also called the true-negative rate. A high score means the model avoids wrongly calling negative cases positive. section 7.13 section 7.18
Count the true negatives, then divide by all actual negatives. In a confusion matrix, the actual negatives include true negatives and false positives, so specificity is true negatives divided by true negatives plus false positives. Specificity is not precision: precision starts with predicted positives, while specificity starts with actual negatives. section 7.13 section 7.17
Healthy people and inbox messages
For a coronavirus test, specificity is the share of healthy people correctly diagnosed as healthy. For spam filtering, it is the share of ham emails correctly delivered to the inbox. If protecting legitimate email matters most, high specificity is especially valuable. section 7.13
Specificity and sensitivity describe opposite kinds of success. Sensitivity is the share of actual positives correctly found; specificity is the share of actual negatives correctly rejected. Which one deserves more attention depends on whether false positives or false negatives are more costly. section 7.12 section 7.13
Figure 7.3 The effects of moving the threshold on the sensitivity and the specificity. On the left, we have a model with a low threshold; in the middle, we have one with a medium threshold; and on the right, we have one with a high threshold. For each of the models, there are five positive and five negative points. Each model is represented by the vertical line. The model predicts that the points to the right of the line are positive and those to the left are negative. For each of the models, we’ve counted the number of true positives and true negatives, that is, the number of positive and negative points that have been correctly predicted. We have used those to calculate the sensitivity and the specificity. Note that as we increase the threshold (i.e., as we move the vertical line from left to right), the sensitivity goes down and the specificity goes up.
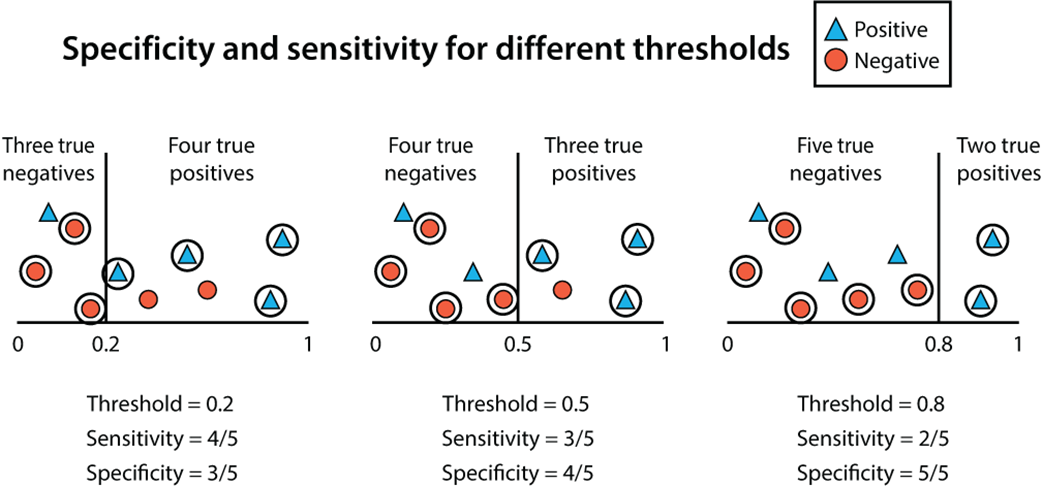
Moving a probability threshold changes which cases become positive predictions. With five positive and five negative cases, thresholds of 0.2, 0.5, and 0.8 produce specificity values of 3/5, 4/5, and 5/5. Raising the threshold increases specificity but decreases sensitivity. section 7.14
This tradeoff makes specificity useful when selecting a decision threshold. A low threshold labels many cases positive, usually giving low specificity. A high threshold labels fewer cases positive, usually giving high specificity. ROC curves record sensitivity and specificity across thresholds so a threshold can fit the use case. section 7.14 section 7.16
Practice from a confusion matrix
Given a medical confusion matrix with 795 healthy people correctly predicted healthy and 63 healthy people predicted sick, calculate specificity as 795 divided by 795 plus 63. The result describes how reliably the model recognizes healthy cases. section 7.19