A spectral method performs graph convolution by filtering a graph signal rather than sliding a filter across node neighborhoods. A graph signal assigns values to nodes; filtering those values offers a way to combine information across the graph. Signal-processing tools such as the Fourier transform provide the guiding interpretation. section 3.4.1 section 3.4.2
Figure 3.13 A random positive graph signal on the vertices of the graph. The height of each vertical bar represents the signal value at the node where the bar originates.
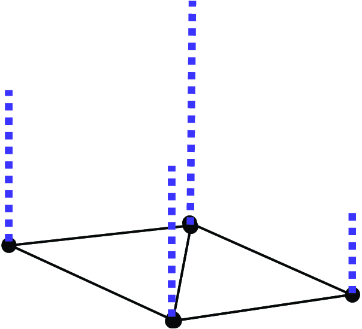
The bars show a graph signal: each bar’s height is the value assigned to its node. section 3.4.1
The contrast with spatial convolution is practical: spatial methods aggregate features from node neighborhoods, while spectral methods use graph-signal filters and, in this comparison, perform convolution using graph eigenvalues. The boundary is not absolute—a GCN’s spectral derivation can also be interpreted spatially. Spatial methods are generally preferred here for fewer restrictions and lower computational complexity; the comparison identifies undirected graphs as a requirement for spectral methods. section 3.4.5
Table 3.9 A comparison of spectral and spatial convolutional methods
|
Spectral
|
Spatial
|
|---|---|
|
Operation: performing a convolution using a graph’s eigenvalues
|
Operation: aggregation of node features in node neighborhoods
|
|
• Must be undirected
• Operation dependent on node features
• Generally less computationally efficient
|
• Not required to be undirected
• Operation not dependent on node features
• Generally more computationally efficient
|
Compare the operations and stated constraints side by side before choosing how to think about graph convolution. section 3.4.5
