liveBook · Manning

Streamlit

As explained in Effective Data Analysis

Streamlit is an open-source Python framework for building and sharing interactive data applications.

Streamlit is an open-source Python framework for building and sharing data-powered applications. It supports quick prototypes, interactive reports, and dashboards that can evolve through stakeholder feedback. section 12.2.1

Streamlit supports practical analytics workflows by providing:

  • Readable Python code resembling workflows built with pandas and seaborn. section 12.2.1
  • Interactive inputs such as text boxes, sliders, and date filters that update dashboard results. section 12.2.1
  • Connections to multiple data sources, including data warehouses and APIs. section 12.2.1
  • Deployment through Snowflake or Streamlit Community Cloud. section 12.2.1
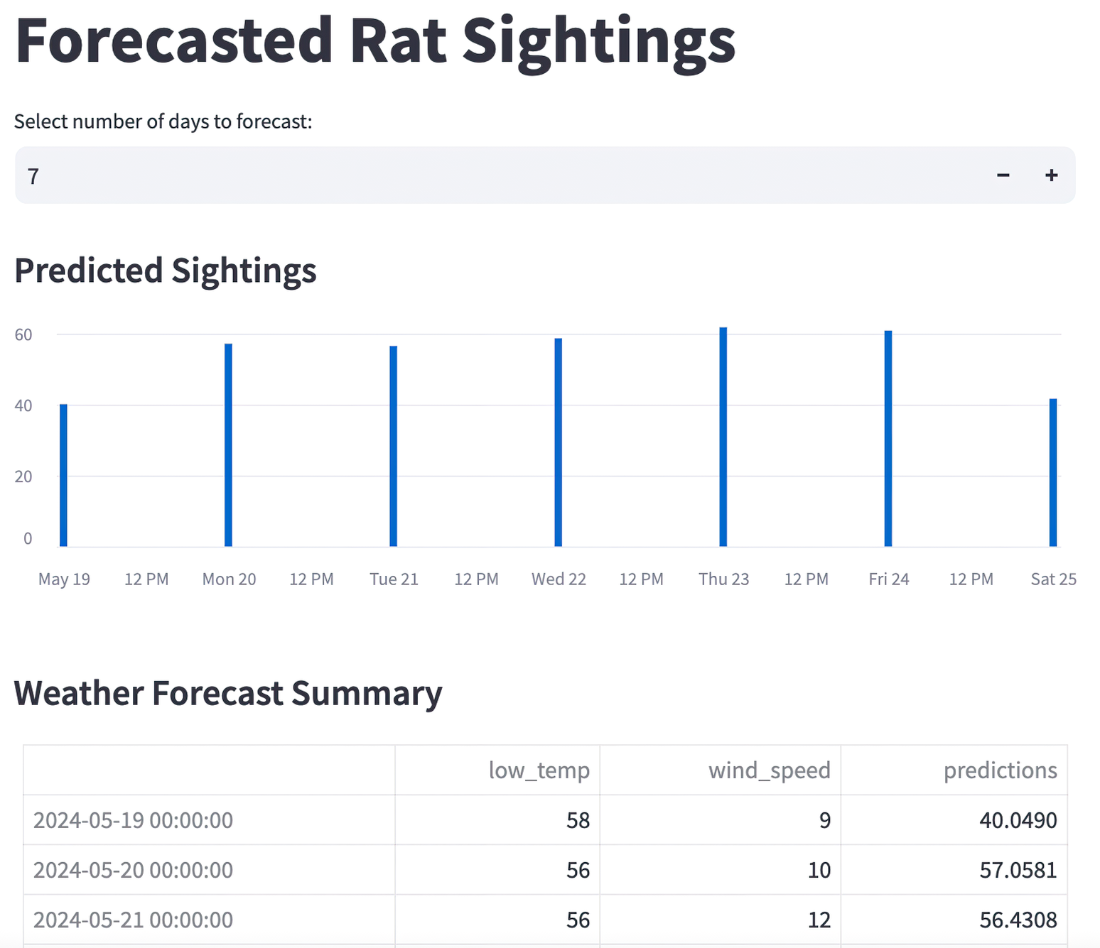
Figure 12.4 An interactive data-powered app predicting rat sightings, created using Streamlit.
figure

Explore an example Streamlit app that predicts daily rat sightings from weather parameters and connected data. section 12.2.1


How Effective Data Analysis covers it

How deep it goes
Explains core capabilities and deployment options but stops short of implementation instructions or framework internals.
Examples
Uses a rat-sighting forecast app combining weather data, regression, derived variables, and a National Weather Service API.
What it assumes
Assumes familiarity with Python data-analysis workflows and packages such as pandas and seaborn.
What you can do after
Build and share interactive Python data applications, prototypes, reports, and dashboards.
How it connects
Connects Python analytics packages, interactive dashboards, APIs, data warehouses, Snowflake, and R Shiny.

Also explained in

Compare how 9 books explain Streamlit →

Related concepts

This explainer was generated by Manning's knowledge graph from the text of Effective Data Analysis. The section links point to the parts of the book it draws on.