A subpopulation is a subset of a broader population selected because its members share characteristics or assignment conditions. In causal analysis, restricting attention to such a subset can make treatment and control cases more comparable, but changes the population to which the result applies. section 5.3.1 section 5.2
Selecting comparable patients
Suppose the control group contains only older patients while the treatment group contains both young and old patients. An analysis restricted to older patients may proceed, but its findings apply only to older people and cannot be extrapolated to younger people. When several confounders identify viable subsets, use their intersection as the subpopulation for further study. section 5.3.1
Propensity-score overlap provides another way to identify a subpopulation. Patients whose scores fall within a common-support interval have potential matches in the opposite group; patients outside it do not. Restricting analysis to the overlapping group may support an estimate for that group, but does not justify extrapolation to dropped patients. section 5.3.3
Figure 5.11 Partial overlap in a distribution’s supports. We can calculate the ATE only for patients within the common support region.
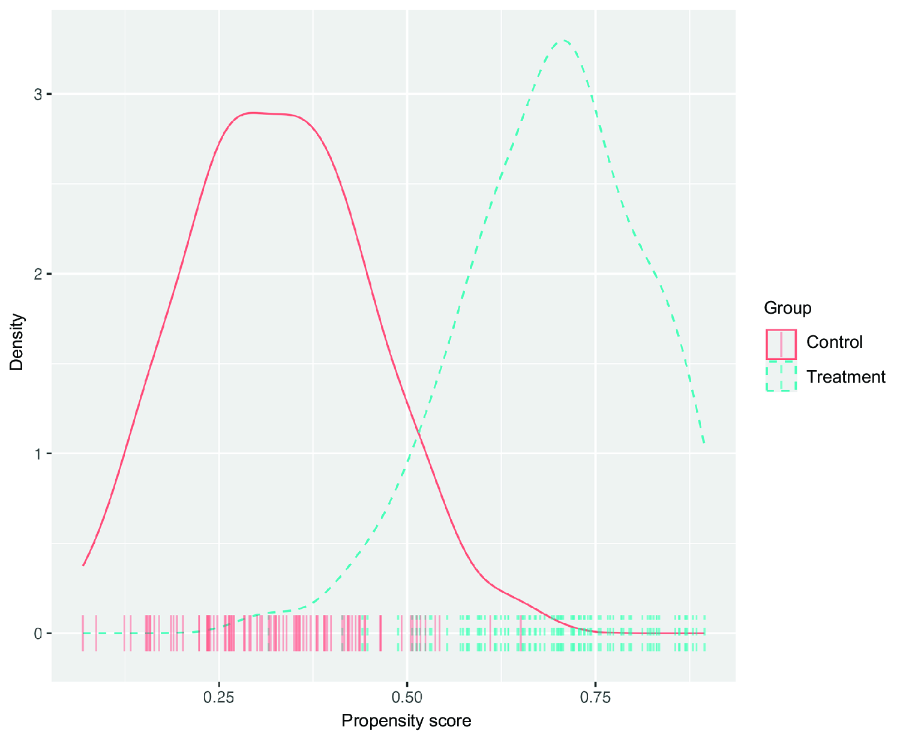
Use the common-support figure to see why partial overlap limits the ATE to matched patients; when overlap consists of treated patients, the estimand becomes the ATT. section 5.3.3

