A subspace is a subset of a dataset’s features considered together. In outlier detection, a model trained on a subspace asks whether a record is unusual in those features, rather than in every feature at once. Different records may be unusual in different subspaces. section 6.10
Subspaces are useful when a dataset has many features. Distance calculations can become less informative in high dimensions, while irrelevant features can obscure a useful signal. Training multiple detectors on smaller feature sets can improve speed and make a high score easier to investigate: the relevant features must be sought within that detector’s set, not the entire dataset. Models can also be fitted and used for prediction in parallel. section 10.1 section 10.1.2
Figure 6.14 The left pane shows point A in a 2D dataspace. The point is unusual considering feature A but not if using Euclidean distances in the full 2D dataspace. Using additional features can be counterproductive. In the middle and right panes, we see another point, point B, which is an outlier in the C–D subspace but not in the E–F subspace. We need only features C and D to identify this outlier.
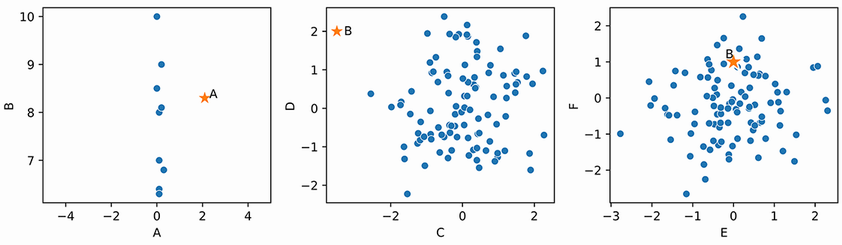
The plots show why feature choice matters: an unusual value can be obscured by a full-space distance, and an unusual feature pair may look ordinary in another pair. section 6.10
Choose subspaces with the detection task in mind:
- Use several features per detector when the full dataset is wide. Subspaces can be selected randomly or based on correlation; the aim is to put features that reveal unusual combinations together. section 10.1.2 section 10.4
- Use two-feature subspaces when plots and clear explanations matter. Covering every pair requires d × (d − 1) / 2 detectors for d features: 4,950 for 100 features. section 10.1.2
- Check what the selected sets cannot see. A detector misses an unusual combination if its features never appear together; two-feature models also cannot capture an anomaly that requires three or more dimensions. section 10.1.2 section 13.3.1
Explaining a flagged record
Fit an Isolation Forest to each feature pair and keep each pair’s score for every record. The highest-scoring pair offers a starting point for inspecting why a record was flagged. It is not necessarily a complete explanation of a full-feature Isolation Forest score; a record may need several pairs, or have a more complex anomaly. section 15.2.3
Subspaces can also form an ensemble. PyOD provides subspace outlier detection (SOD) and FeatureBagging; sampling features lets different detectors attend to different signals. Remove features that consistently produce irrelevant flags, while allowing an especially strong feature into some—but not necessarily all—detectors so it does not mask other anomalies. Differences between full-feature and subspace scores call for investigation, not an automatic preference for either result. section 6.10 section 14.3.4 section 13.3.1
Figure 13.10 An explanation of the top-scored record in the dataset given an ensemble of 2D models. In all four subspaces, the record (shown here as a star) is distinctly anomalous. In this example, each subspace includes the Height feature, suggesting its value is incongruous with the other values for this record.
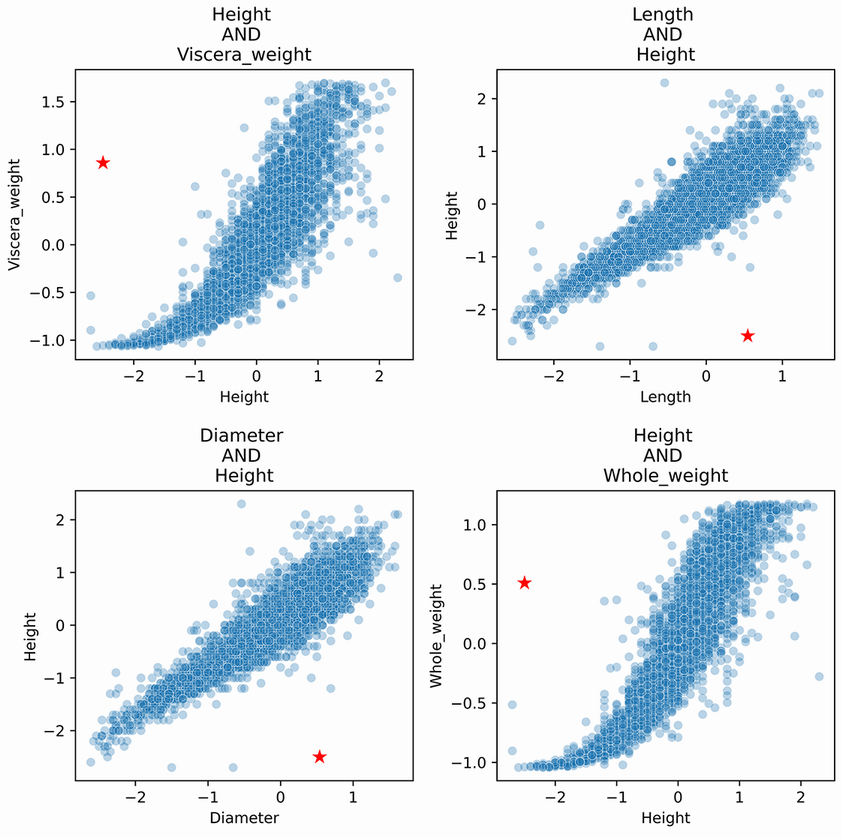
Four feature-pair views show the same high-scoring abalone record as anomalous. Their shared Height feature helps narrow the investigation without claiming that one pair tells the whole story. section 13.3.1
