Time series analysis studies observations ordered by time to reveal trends, cycles, seasonal patterns, outliers, and other changes. It helps teams replace static snapshots and gut feeling with evidence about how business metrics and events evolve. section 4.3 section 4.5
Build a useful time series by making deliberate choices about the data and the question:
- Attach every observation to a timestamp, using a granularity from milliseconds to years as the analysis requires. section 4.3.1
- Distinguish event-based data, which records irregular actions such as clicks, from metric-based data aggregated at fixed intervals. section 4.3.1
- Use enough historical data to avoid mistaking a short-lived spike, such as viral traffic, for a lasting trend or seasonal pattern. section 4.3.1
- Interpret recurring intervals as seasonality, unusual deviations as anomalies, and smoothed movements as more readable trends. section 4.3.2
E-commerce operations
Nina tracks clicks, searches, purchases, and page views on a fashion platform. Activity peaks during lunch breaks and evenings, so she schedules more customer support then. She uses holiday and spring demand cycles to guide campaigns, inventory, and recommendations. A sudden burst of clicks from a new user triggers investigation for possible bot activity. section 4.3.2 section 4.3.3
Table 4.3 In time series data, each data record
is associated with a timestamp.
| Event |
Timestamp |
| Click |
2024-08-19 12:01:35.123 |
| Search |
2024-08-19 12:02:18.456 |
| Add to cart |
2024-08-19 12:03:05.789 |
A timestamped event table makes the time dimension concrete, showing how clicks, searches, and cart additions form an event-based series. section 4.3.1
Figure 4.6 Anomalies can show up as extreme peaks or troughs in the data.
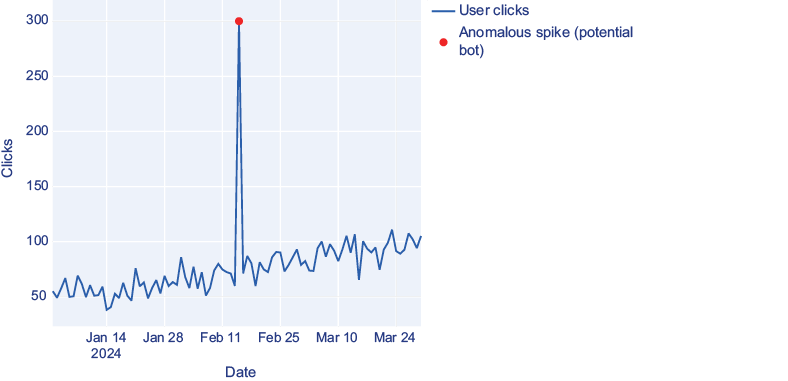
An anomaly figure helps readers recognize extreme peaks or troughs as deviations requiring investigation. section 4.3.2



