A time-series database stores pre-aggregated counters and histograms for operational metrics, making time-range queries efficient. In an observability architecture, it complements logs, traces, and quality scores rather than replacing them. section 7.7
Use it for aggregate operational views such as:
- Request volume, latency distributions, cost trends, and error rates. section 7.7
- Queries such as “what was the p99 latency for the patient intake workflow over the last 24 hours?” section 7.7
- Threshold alerts, including paging when p95 latency exceeds five seconds for ten consecutive minutes. section 7.7
Figure 7.9 A sample observability dashboard. KPI cards provide an at-a-glance summary. The latency chart pulls from the Time-Series DB, the cost breakdown queries the Trace + Generation Store, and quality trends come from the Score Store. Alerts fire when metrics cross configured thresholds. Clicking any data point or flagged trace opens the trace viewer, closing the loop between aggregate monitoring and individual request debugging.
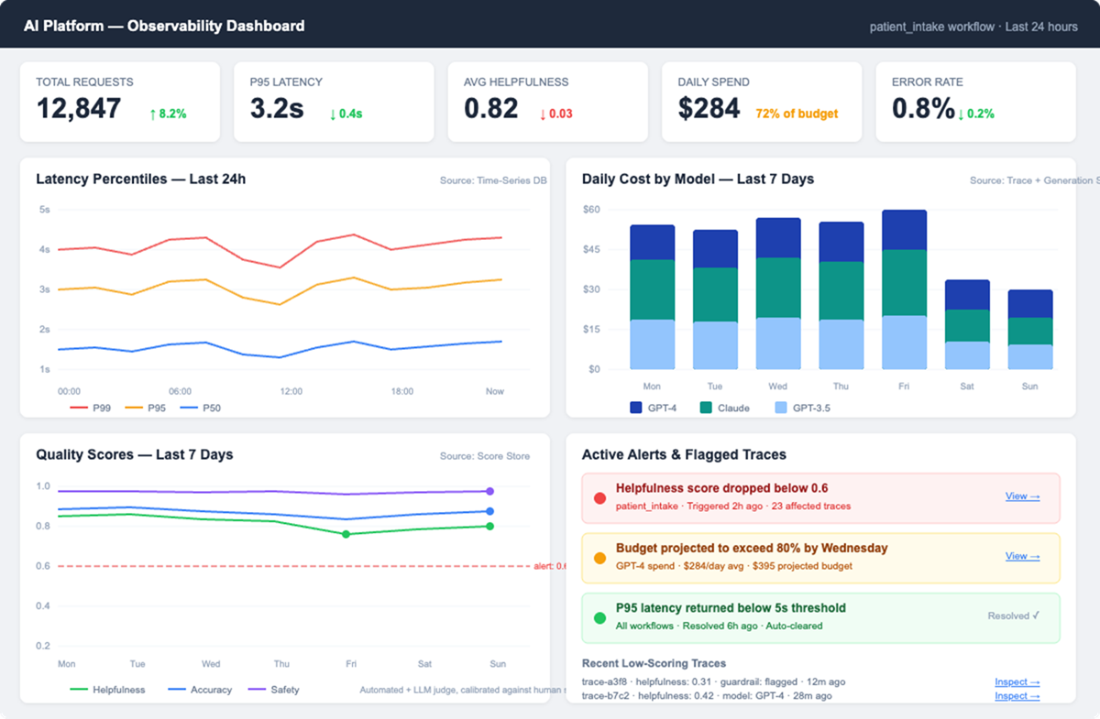
Shows how latency charts query the time-series database while dashboards connect aggregate signals to alerts and trace-level investigation. section 7.7



