A learning curve plots training and test error against training-set size. It reveals whether a model’s performance is limited mainly by bias, variance, or insufficient data. section 4.4.2 section 4.4.1
Read the curves by comparing their levels and the gap between them:
- Few training samples often produce low training error but high test error, indicating overfitting and high variance. section 4.4.2
- As the dataset grows, training error commonly rises while test error falls; convergence suggests that additional data may provide little benefit. section 4.4.2
- A higher converged error indicates greater bias, while a persistent train-test gap indicates variance that may require more data or regularization. section 4.4.2
- Construct curves by measuring a chosen score as training size changes, commonly with Scikit-Learn cross-validation. section 4.4.1
Solubility models
For solubility prediction, RANSAC showed higher training MSE, consistent with higher bias, but its train-test gap shrank toward zero. SVR had lower bias and higher variance; additional training data could therefore reduce its overfitting. section 4.4.2
Figure 4.19 Learning curves for RANSAC and SVR models.
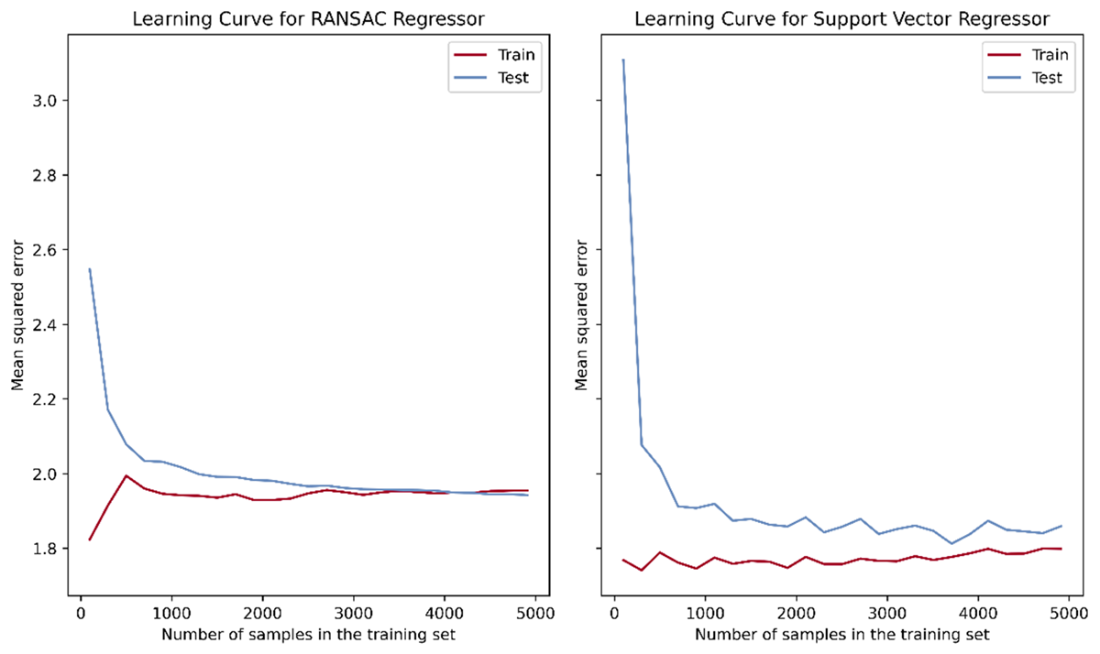
Inspect the plotted learning curves for the RANSAC and SVR solubility models. section 4.4.2