A treatment does not always work equally well for everyone. Suppose a travel agency raises a flight ticket price by $5: the same increase may reduce holiday sales less than sales outside the holiday season. When a causal effect varies across seasons, covariate levels, or subpopulations, it is a heterogeneous treatment effect. section 8.1.4
An ordinary partially linear model assumes one constant treatment effect: sales = β price + g(season) + V. To measure effects for particular values of a variable X, estimate a conditional average treatment effect (CATE), such as the average effect of price separately by season. section 8.1.4
Interactions represent heterogeneous effects
A linear model without interactions, L = a + bP + cS + U, gives every season the same price slope. Adding an interaction, L = a + bP + cS + dP × S + U, allows the slope to change with season: it is b when S = 0 and b + d when S = 1. section 8.1.4
Double machine learning can estimate heterogeneous effects after flexible predictive modeling. It removes confounder influence from both treatment and outcome, then uses the remaining residual variation to estimate causal effects for different subpopulations, such as loyal and infrequent clients. section 8.1 section 8.0
Heterogeneity also changes what can be learned from treated and untreated units. With chatbot use, the effect among treated customers may differ from the population effect; without homogeneity, ATE and ATET need not agree. section 10.4
Graph used throughout this chapter. C denotes the vector of confounders, D stands for decision, and O is the outcome.
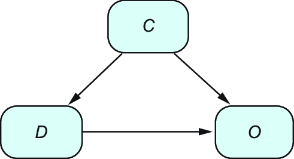
Use the causal graph to identify confounders, treatment, and outcome before estimating heterogeneous effects. section 8.1
