Modernization offers more possible starting points than a team can pursue at once. A modernization core domain chart makes those choices visible so people can compare subdomains and decide where to start—or what to tackle next. It adapts the Core Domain Chart into a collaborative impact-versus-effort view. section 16.2.2
Plot each candidate subdomain by the value of modernizing it on the horizontal axis and the complexity of modernizing it on the vertical axis. Value includes progress toward business outcomes, such as new product capabilities, and learning that helps with later decisions, such as validating a technology choice or pattern. section 16.2.2
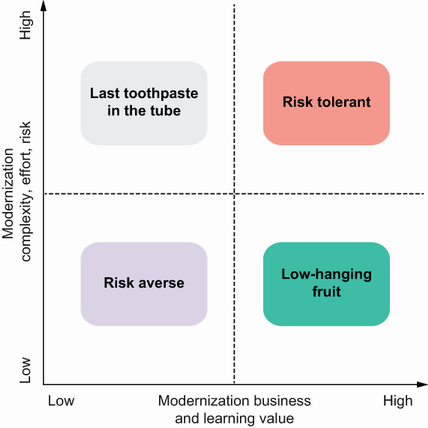
Use the chart to see which opportunities combine high value with low complexity, and which require substantial effort for little apparent return. section 16.2.2
Two contrasting positions help frame the discussion:
- Low-hanging fruit has high modernization value and low complexity, making it an attractive early investment. section 16.2.2
- The “last toothpaste in the tube” has low value and high complexity. Leave it until later or avoid modernizing it unless a risk or other benefit changes the value assessment. section 16.2.2
Comparing two legacy subdomains
A legacy component that can be rewritten without changing the surrounding system, while adding features that advance a product goal, may be low-hanging fruit. A million lines of untested stored procedures that are unlikely to change offer a much weaker return for the effort. If those procedures pose a serious security or reputation risk, preventing that loss belongs in the value discussion. section 16.2.2
Treat the positions as a basis for discussion, not a permanent verdict. When a decision needs finer criteria, use a scorecard. The chart can also make prioritization decisions legible alongside a roadmap and portfolio of modernization investments. section 16.2.2 section 16.1.1
