The Tweedie distribution is useful when a target has two behaviors at once: many exact zeros and a right-skewed set of positive values. Rainfall is a natural example: most days are dry, while a few produce very large totals. Rather than forcing one ordinary distribution to fit both regions, a Tweedie likelihood can model the combined shape. section 7.3.1
Figure 7.11 Modeling some types of labels effectively requires combinations of distributions, called compound distributions. One such compound distribution is the Tweedie distribution.
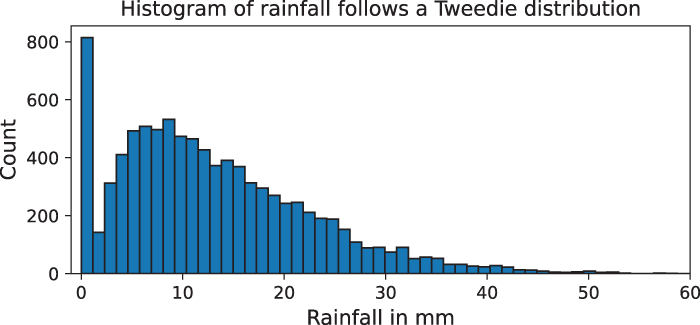
This compound-distribution view shows why a single target can need both a zero-generating component and a positive, skewed component. section 7.3.1
A Tweedie family is controlled by a power parameter p. Familiar distributions appear at particular values: p=0 is Gaussian, p=1 is Poisson, p=2 is gamma, and p=3 is inverse Gaussian. The practically important interval 1<p<2 gives Poisson-gamma forms: Poisson behavior accounts for the large spike at zero, while gamma behavior accounts for positive continuous values with a long right tail. section 7.3.1
Choose among related likelihoods by matching the target’s observed shape:
- Use a Gaussian-style regression baseline for continuous targets when a normal-distribution assumption is reasonable. section 7.4.2
- Use Poisson regression for count-valued targets; Tweedie with power=1 is equivalent to scikit-learn’s PoissonRegressor. section 7.4.2
- Use gamma regression for positive, right-skewed continuous targets without emphasizing a mass at zero. section 7.5
- Consider Tweedie regression when zeros coexist with a long positive tail, then search powers between 1 and 2. section 7.3.1 section 7.4.2
In regression, the distribution supplies a likelihood and corresponding loss suited to the label type. Tweedie regression is a generalized linear model using a log-link function. In scikit-learn, TweedieRegressor exposes alpha for L2 regularization and power for the distribution choice; power can be tuned with cross-validation and grid search rather than guessed from a single histogram. section 7.4.2 section 7.5
Bike rental demand with many zeros
For the casual-bike-user target, values range from 0 to 367, with a large spike at zero and a long right tail. A log(1+y) histogram resembles the rainfall pattern, motivating a Tweedie candidate alongside Poisson and linear regression. A grid search evaluates Tweedie powers from 1.1 to 1.9 and regularization values, then compares test MSE, MAE, and R². In the reported comparison, Poisson and Tweedie models show more promise than the normal-assumption linear baseline, while a stacked ensemble improves further. section 7.4.1 section 7.4.2
This choice is not limited to linear GLMs. LightGBM and XGBoost support Tweedie objectives as well as link functions and related Poisson and gamma distributions. That makes the likelihood useful when the target’s distribution calls for GLM-style reasoning but the feature-target relationship may require nonlinear ensemble models. Common application areas include weather, insurance, and health analytics. section 7.3.1 section 7.5

