An unobserved confounder influences both treatment and outcome but is not measured or available in the data. This creates a practical causal problem: the treatment-outcome association mixes the treatment effect with the confounder’s influence. section 2.5.3
Kidney treatment decisions
Suppose doctors choose a kidney-stone treatment using stone size, but the software never stored stone size. The adjustment formula requires P(O | T, C) and P(C); without any information about C, the causal effect of T on O cannot be estimated directly. Omitting a relevant confounder can even reverse the treatment choice, as illustrated by Simpson’s paradox. section 2.5.3
Figure 2.12 Graph with an unobserved confounder (we don’t have data about this variable).
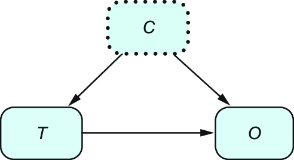
A causal graph marks the unavailable confounder with dashed lines, making the missing adjustment information explicit. section 2.5.3
Treat unobserved confounding as a limitation rather than an ordinary missing-data detail:
- State explicitly when relevant confounders may be missing, and communicate that assumption to people relying on the analysis. section 2.5.3
- Do not assume that adjusting for observed variables automatically removes bias; more complex graphs may contain relationships among observed and unobserved confounders. section 2.5.9
- Consider instrumental variables when the adjustment formula cannot be applied because confounders are unobserved, but only when the required graph structure and assumptions hold. section 9.0
Synthetic instrumental-variable check
A synthetic dataset contains an unobserved binary confounder affecting treatment and outcome. The true treatment effect is −2, while naive regression and a difference in means estimate about 1. An instrumental-variable estimate gives −1.8898, closer to the true effect under the stated assumptions. section 9.3
