Visual management makes the state and behavior of work visible to the people doing it. A basic Kanban board tracks where tickets are; a diagnostic board also reveals how work flows and where it stalls. section 9.4
Read the board for signals about the system:
- A deep column indicates a queue; a review pile-up can reveal a bottleneck. section 9.4
- Items at or above WIP limits indicate overload; ageing tickets point to stalled work; blocked indicators reveal dependencies. section 9.4
Figure 9.11 A dashboard Kanban board is read as a diagnostic tool. The Ready for Review section has five items, more than any other column, revealing a queue at the review station. Items can be color-coded by age. The queue, colors, and intention are visible at a glance.
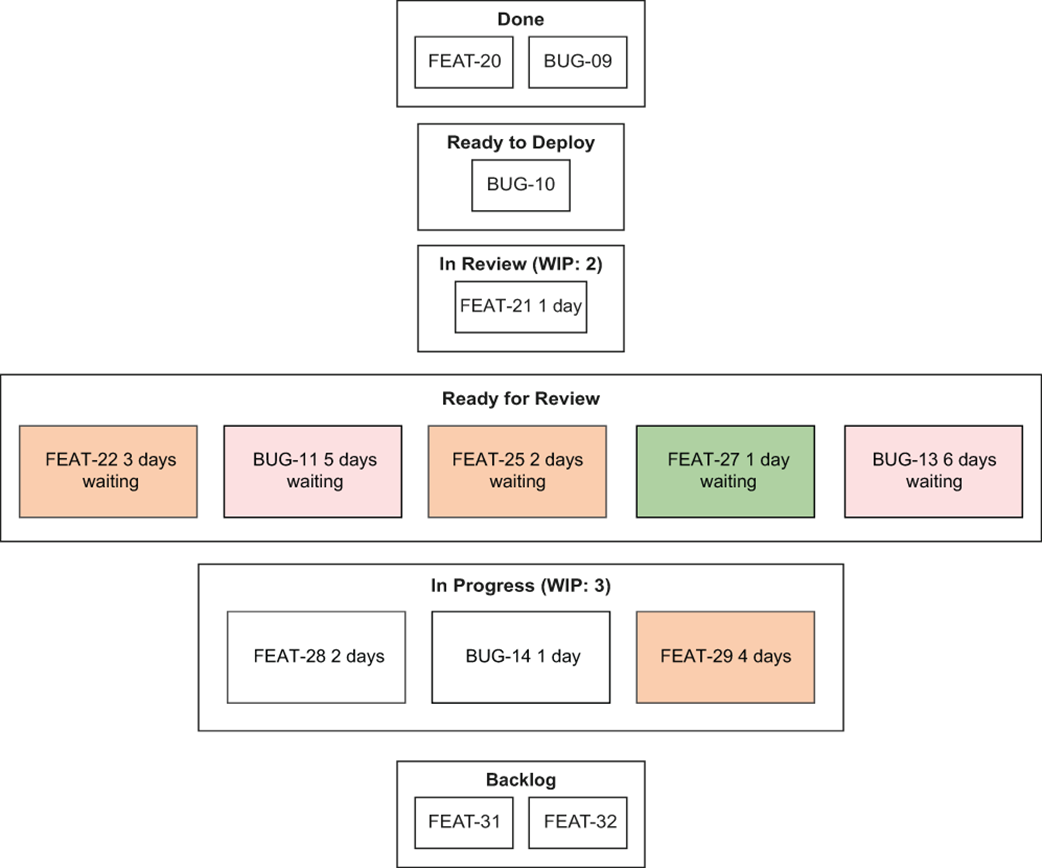
A review-column queue and age-colored tickets show how a board can expose flow problems at a glance. section 9.4
A board is a snapshot; a flow dashboard shows how the system changes over time. Use trends and distributions—including lead time, cycle time, deployment frequency, and change failure rate—to assess system health. Make displays useful to the people doing the work. section 9.4.1
Figure 9.13 A minimal team flow dashboard. Six metrics, each answering a different question about system health.
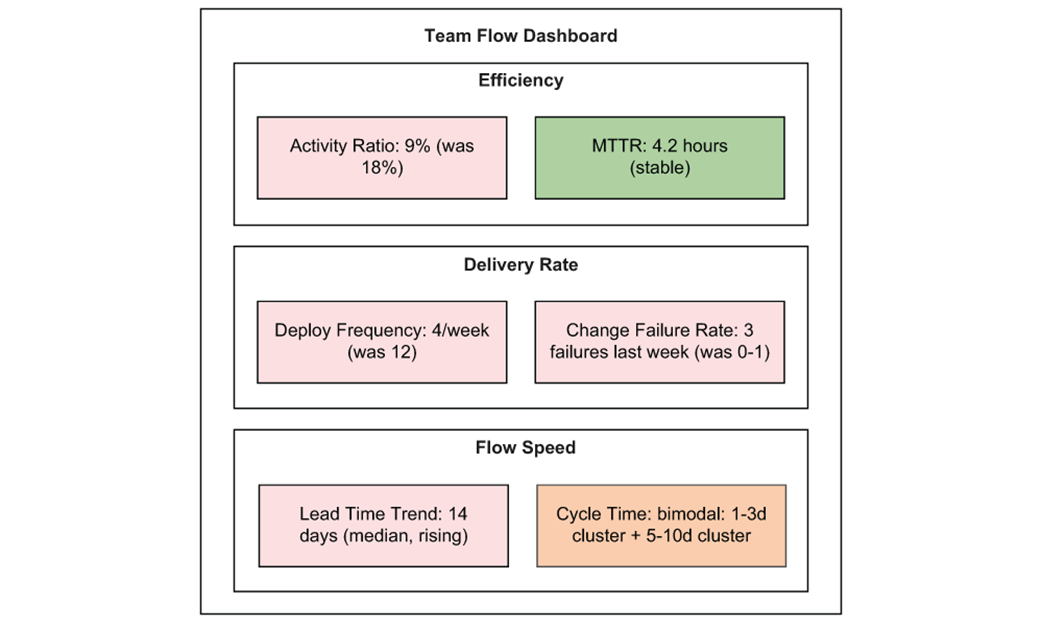
The dashboard example brings together six metrics, each answering a different question about system health. section 9.4.1
