A network waterfall visualizes every requested resource as a timeline. Horizontal bars show download duration, while ordering reveals request sequencing, parallelism, and blocking dependencies. section 7.1.1
Use the waterfall to inspect loading performance systematically:
- Open the network panel while developing a feature that loads data or renders content. section 7.1.1
- Enable Slow 4G throttling with cache disabled to approximate a first-time visitor on a poor mobile connection. section 7.1.1
- Compare transfer size with resource size, then sort by size to expose large contributors and inspect blocking sequences. section 7.1.1
Article template under Slow 4G
A news article page transfers 723 kB but contains 1.9 MB of uncompressed resources against a 500 kB budget. Three synchronous scripts in the head delay rendering, while a font dependency waits for its CSS. section 7.1.1
Figure 7.2 A network waterfall under Slow 4G throttling. Three synchronous scripts block rendering for over two seconds. The font dependency chain shows how font files cannot begin loading until the CSS that references them has downloaded. The bottom bar reveals the gap between transfer size (723 kB compressed) and resource size (1.9 MB uncompressed).
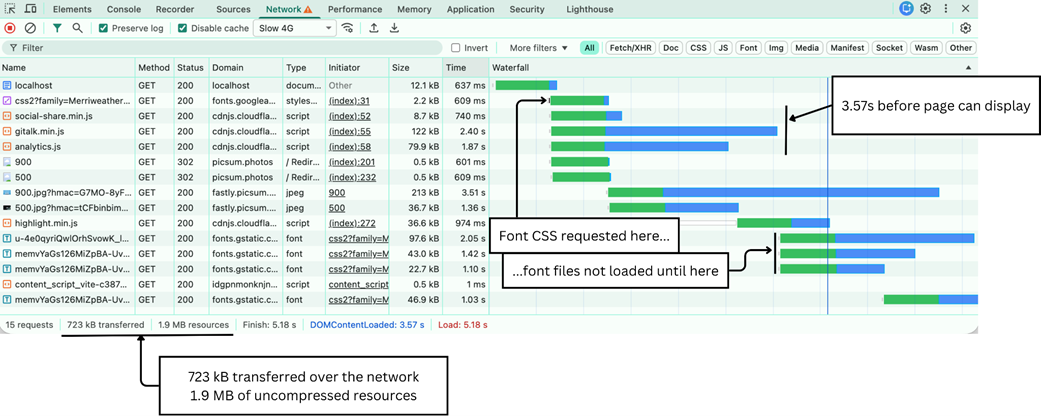
Inspect the waterfall figure to see synchronous scripts blocking rendering, the font dependency chain, and compressed versus uncompressed size. section 7.1.1

