A waveform represents a time-varying signal as a sequence of amplitude values sampled at discrete points in time. Digital audio stores these values at thousands of time positions, preserving the signal's temporal structure while containing frequency information implicitly. section 6.3.5
Audio models usually do not consume the raw waveform directly. Short-time Fourier transform analysis divides it into overlapping windows and converts each window into frequency information, producing a spectrogram with time, frequency, and amplitude dimensions. section 6.3.5
A practical audio pipeline treats the waveform as the handoff between extraction and model inference:
- Extract a mono waveform from a video and resample it to the audio encoder's expected 16 kHz rate. section 6.3.6
- Provide the waveform and sampling rate to a reusable multimodal inference helper alongside a text prompt. section 6.3.6
Inspecting and querying an audio waveform
A 16 kHz waveform can be visualized as a mel spectrogram with librosa using an 1,024-point FFT, a 256-sample hop, and 80 mel bands. The same waveform can then support prompts for instrument and genre analysis or speech transcription and summarization.
Figure 6.7 Mel spectrogram of the trumpet example from the Librosa library
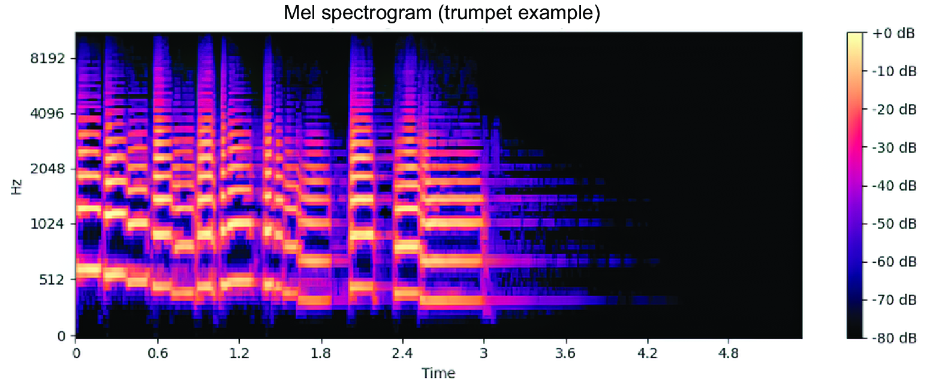
Use the mel spectrogram figure to inspect how waveform energy is distributed across time and perceptual frequency. section 6.3.5

