Anomaly detection identifies observations or patterns that substantially deviate from expected behavior. In time series, a practical approach forecasts historical values and flags points outside a prediction interval. section 3.8
Forecast-based detection repurposes probabilistic forecasting rather than using a separate anomaly-specific technique. Rolling or historical forecasts produce lower and upper bounds; an actual value outside those bounds receives an anomaly label. section 3.8 section 6.4
A typical implementation proceeds as follows:
- Prepare a time series with timestamps, target values, and—when available—actual anomaly labels for evaluation. section 3.8.1
- Generate historical or rolling forecasts over the period being tested, using windows and a forecast horizon that cover the desired dates. section 5.8 section 6.4
- Compute prediction intervals and flag each actual value below the lower bound or above the upper bound. section 9.5 section 9.5.1
- Measure precision, recall, and F1 score; inspect the trade-off because narrower intervals increase recall but reduce precision. section 3.10 section 6.4
Daily taxi rides
On daily New York City taxi-customer counts from July 2014 through January 2015, TimeGPT used historical forecasts and a 99% prediction interval. It labeled eight points anomalous while four were actual anomalies, illustrating false positives and missed early points. Chronos found all labeled anomalies but achieved only 21% precision; Moirai also found all actual anomalies and achieved the best reported F1 score in that experiment, 0.53. These single-dataset results are comparisons, not comprehensive benchmarks. section 3.8.1 section 5.8 section 6.4
Figure 3.18 Plotting the anomalies detected by TimeGPT. The dotted line shows the historical forecasts. The shaded area represents the 99% prediction interval. If a point falls outside the interval, it is labeled an anomaly. Diamonds indicate predicted anomalies, and dots represent the actual anomalies not detected by TimeGPT. If a detected anomaly and an actual anomaly coincide, meaning that the model identified the anomaly correctly, only a diamond is shown.
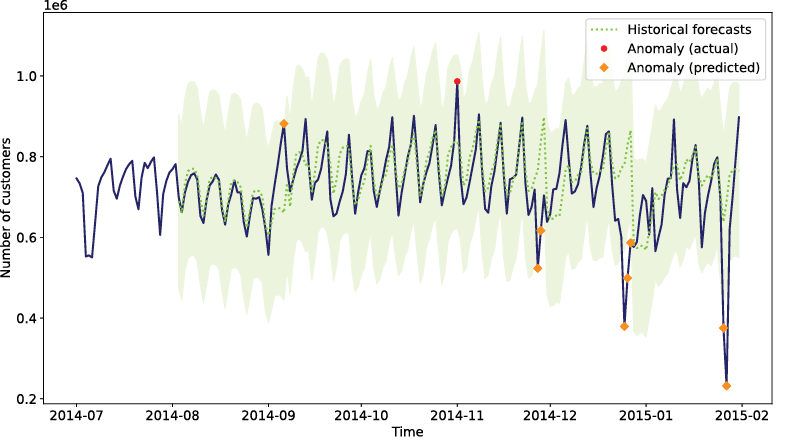
Inspect the forecast line, shaded 99% prediction interval, predicted anomaly diamonds, and labeled anomaly dots. section 3.8.1






