Suppose a game team wants to know whether greater side-quest engagement increases in-game purchases. The average treatment effect (ATE) answers a precise intervention question: how much would purchases change, on average, if engagement were set to high rather than low? An observed difference between highly and lightly engaged players does not by itself answer that question; other causes of both engagement and purchases may explain it. section 11.1 section 11.2
For a binary treatment X and outcome Y, write ATE = E[Y | do(X = 1)] − E[Y | do(X = 0)]. Equivalently, ATE = E[Y₍X=1₎ − Y₍X=0₎]: the population average of the difference between the treated and untreated potential outcomes. The treatment and its two values must be specified before estimating anything. section 7.4.1
Choose the effect before choosing an estimator
Players in a past experiment were randomly assigned either game mechanics encouraging side quests or unchanged mechanics. Comparing purchases by assignment estimates the effect of that modification. It does not directly estimate the effect of high versus low engagement: engagement also has other causes. For the latter question, engagement is the treatment and purchases are the outcome. section 11.1
A practical estimation workflow separates the causal question from the computation:
- Select the treatment, outcome, and contrast. Build a causal directed acyclic graph (DAG) that includes plausible shared causes; check whether proposed adjustment variables are confounders rather than colliders. section 11.1 section 11.2
- Identify an estimand under the graph’s assumptions. In the gaming example, a backdoor adjustment uses guild membership, time spent playing, and player skill level. section 11.4.1
- Estimate that quantity from data. With the specified linear regression, regress purchases on engagement and those adjustment variables; the engagement coefficient is the ATE estimate. Examine its confidence interval and whether linear regression is suitable. section 11.4.1
Figure 11.2 An expanded version of the online gaming DAG. With respect to the causal effect of side-quest engagement on in-game purchases, we add two additional confounders and two instruments.
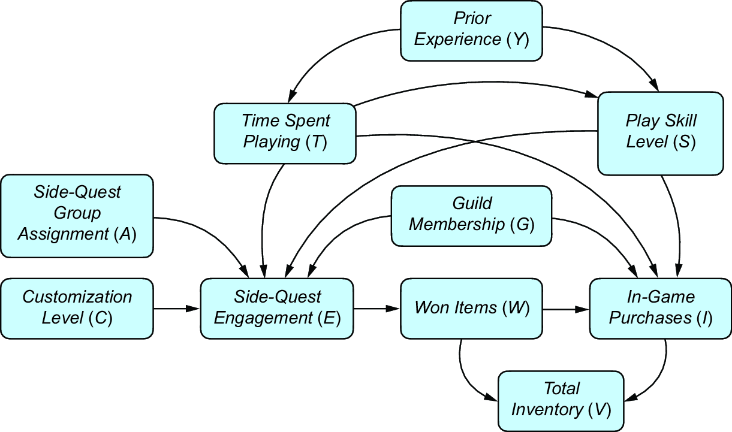
The gaming DAG makes the treatment–outcome question and candidate confounders visible before variables are selected for estimation. section 11.2
In the illustrated linear-regression output, the estimated mean effect is about 178.09, with a 95% confidence interval of about 168.68 to 187.49. That result depends on the identified adjustment and the estimator, not merely on fitting a predictive model. A separate route fits a causal generative model to data, applies an intervention operator, and uses probabilistic inference; a variational autoencoder and Bayesian estimation support latent variables and parameter uncertainty. section 11.4.1 section 11.6

