Average treatment effect (ATE) estimation asks a practical causal question: across a population, how much would the average outcome change if everyone received treatment A rather than treatment B? It is not the same as predicting outcomes or comparing whatever groups happened to receive each option. For a binary treatment X and outcome Y, the target is E[Y|do(X=1)] − E[Y|do(X=0)]: the difference between average outcomes under two interventions. section 1.3.4 section 4.2.4
In a randomized A/B test or randomized controlled trial, the difference in group averages estimates the ATE because random assignment makes groups comparable when the sample is sufficiently large. A recovery rate of 80% under a new treatment versus 70% under an old one suggests an estimated ATE of 10 percentage points. section 1.3.4 section 1.8
Observational comparisons need more care. If age affects both medication choice and recovery, age is a confounder: a raw difference in treated and untreated averages can mix the treatment effect with age differences. Causal diagrams help identify this shared cause and determine whether adjustment is appropriate. section 1.4.2 section 2.0
Figure 1.6 Apart from how treatment may affect recovery, there’s a third element affecting both simultaneously. These elements are called confounders. For instance, in this example, age is a confounder.
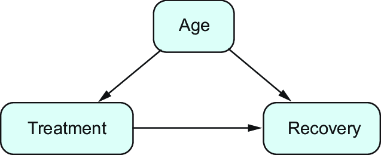
Use the diagram to spot the key threat to a raw ATE comparison: age points to both treatment and recovery, so it can distort their observed association. section 1.4.2
Common routes to estimating an ATE are:
- Adjust for measured confounders with the adjustment formula to estimate outcomes under each intervention, then compare their expected values. section 2.2.5
- Use an S-learner or T-learner to model outcomes under each treatment; cross-fitting can help limit overfitting. section 4.2.4
- Estimate propensity scores, compare cases with similar treatment probabilities, and verify positivity through overlap before calculating effects. section 5.1.4 section 5.3.3
A recommendation can predict without causing
A recommender may correctly predict that a customer will buy bread, yet have no causal effect if the customer would buy it anyway. An A/B test comparing an app with recommendations against one without them estimates whether recommendations change sales; in the extreme no-influence case, the ATE is zero. section 3.3.1
ATE estimation depends on the causal setup. Propensity-score methods assume relevant confounders have been included, and positivity requires comparable treated and control cases. With no overlap, an ATE cannot be calculated; with partial overlap, it applies only to the common-support population. section 5.3.4 section 5.3.3

